What are isochrone maps?
Valhalla, Mapzen’s routing engine, recently gained the ability to return amazing structures called isochrones. What’s an isochrone? The word is a combination of two Greek roots – iso means equal and chrono means time. So indeed, an isochrone is a structure representing equal time. In our case, it’s a line that represents constant travel time about a given location. One can think of isochrone maps as somewhat similar to topographic maps, but instead of lines of constant height, lines are of constant travel time are depicted. For this reason other terms common in topography apply, such as contours or isolines.

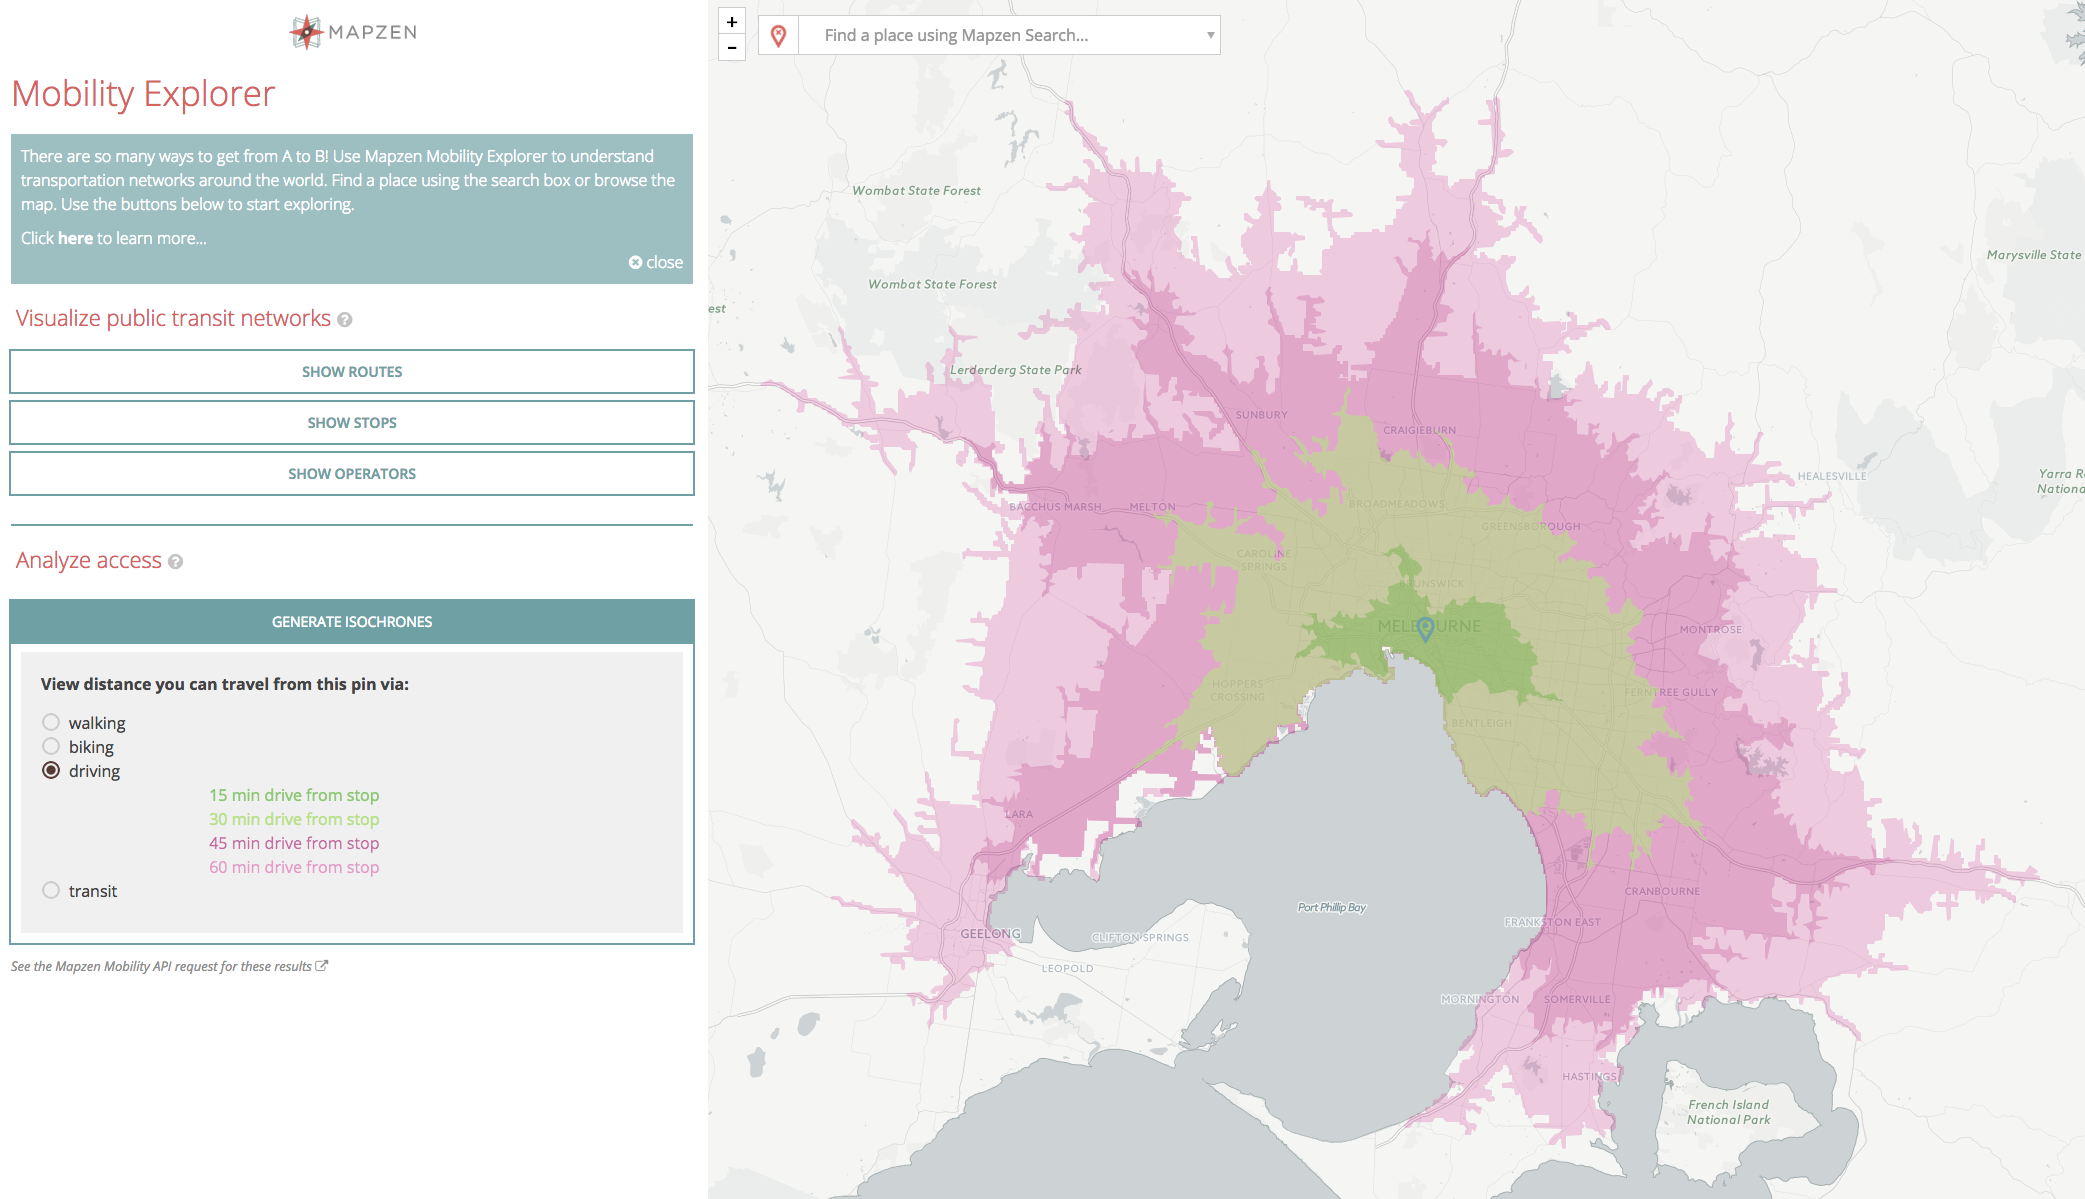
Isochrone of Melbourne driving times, via Mapzen Mobility Explorer
How are isochrone maps useful?
Isochrone maps can be used to make informed decisions about travel at an individual level and en masse. You can get quantitative answers to questions like:
- What are our lunch options within 5 minutes from here?
- How much of the city lives within walking range of public transit?
- What would adding/removing this road/bus stop/bridge do to travel times?
- Where can I find housing that still has a reasonable commute to the office?
An isochrone map service has a wide variety of use case, from planning departments of DOTs all the way down to consumer applications.
Technical details
Isochrones are formed in Valhalla by first creating a 2-D grid in latitude,longitude about the location. This 2-D grid, or array, is used to define the time or cost it takes to get from the target location to each other grid location. This grid is populated by doing a breadth-first, least-cost first search (basically Dijkstra’s) from the origin location. At each iteration, the grid cells that are touched by a road segment or graph edge are marked with the time and cost from the origin, if less than the currently marked time. Once the expansion of the graph exceeds the maximum isochrone contour time, the grid-marking process terminates. This leaves a 2-D grid that has the time or cost to reach each grid location. It can be used to provide a very fast (but approximate) way to query the time/distance for many locations about an origin. Ultimately this could be a way to do very large one-to-many matrices. At this time we do not return the 2-D array of times, but this is a possibility in the future.
Instead, the 2-D grid is used to find the isochrone contours by using a well-known contouring method developed by Paul Bourke in the 1980s. This method finds grid cells that have neighbors with values that lie on opposing sides of the contour value. (Another way of looking at it: the current cell has a time value above the contour value and a neighbor has a time value below the contour value.) The contouring algorithm generates line segments between adjacent grid cells based on several possible cases. The result is a set of 2 point line segments for each.
We are then left with a minimization problem where we want to chain together as many adjacent 2 point pieces as possible. This gets a bit tricky because the segments follow no specfic order or direction, meaning you may have to search the whole list to find a pair of adjacent segments, and once you do, you may have to switch the order of the points to append or prepend it to a chain. We end up hashing the endpoints of each segment so we can easily find which ones are adjacent. In the end we are left with the minimum number of lines representing each contour value.
Rendering
Raster-based rendering of isochrones is by far the most common method of display. This presents a bit of a problem in that you don’t have much control over what appears in the raster (each pixel), so you’ve got to convert the raster to something you can display in your preferred style. Because of this, while internally compute isochrones using a raster datatype, we currently return vectorized data.
We currently support linestring and polygon primitive types in the API. Rendering linestring data is quite straight-forward.
(Mexico City driving isochrones
20 min, 15 min, 10 min, 5 min)
Rendering polygons is tricky business. When working with isochrones its generally useful to see them in the presence of a map. So to be able to see the map one must render the polygons as semi-transparent (unless you’ve got a vector based map like Tangram where you could add the isochrone polygons into a map sandwich). Because isochrones are actually contours, the polygons returned will be necessarily nested. This nesting causes overlapping transparent polygons, which leaves you with portions of the map that have blended colors from two different isochrones and even worse, varying amounts of transparency. To solve this we need a couple of things – the geometry of the polygons has to be free of degeneracies (say self-intersections), and holes in polygons have to be properly represented. These are not currently implemented, but we’re working on it.
Consider your use-case, read the docs linked below, and use your best judgement to determine if rendering isochrones as linestrings or polygons is right for you!
Where is it?
You can find the API documentation here and you see a live demo of it right here. Isochrones are also a key part of Mapzen Mobility Explorer. Let us know what you think!