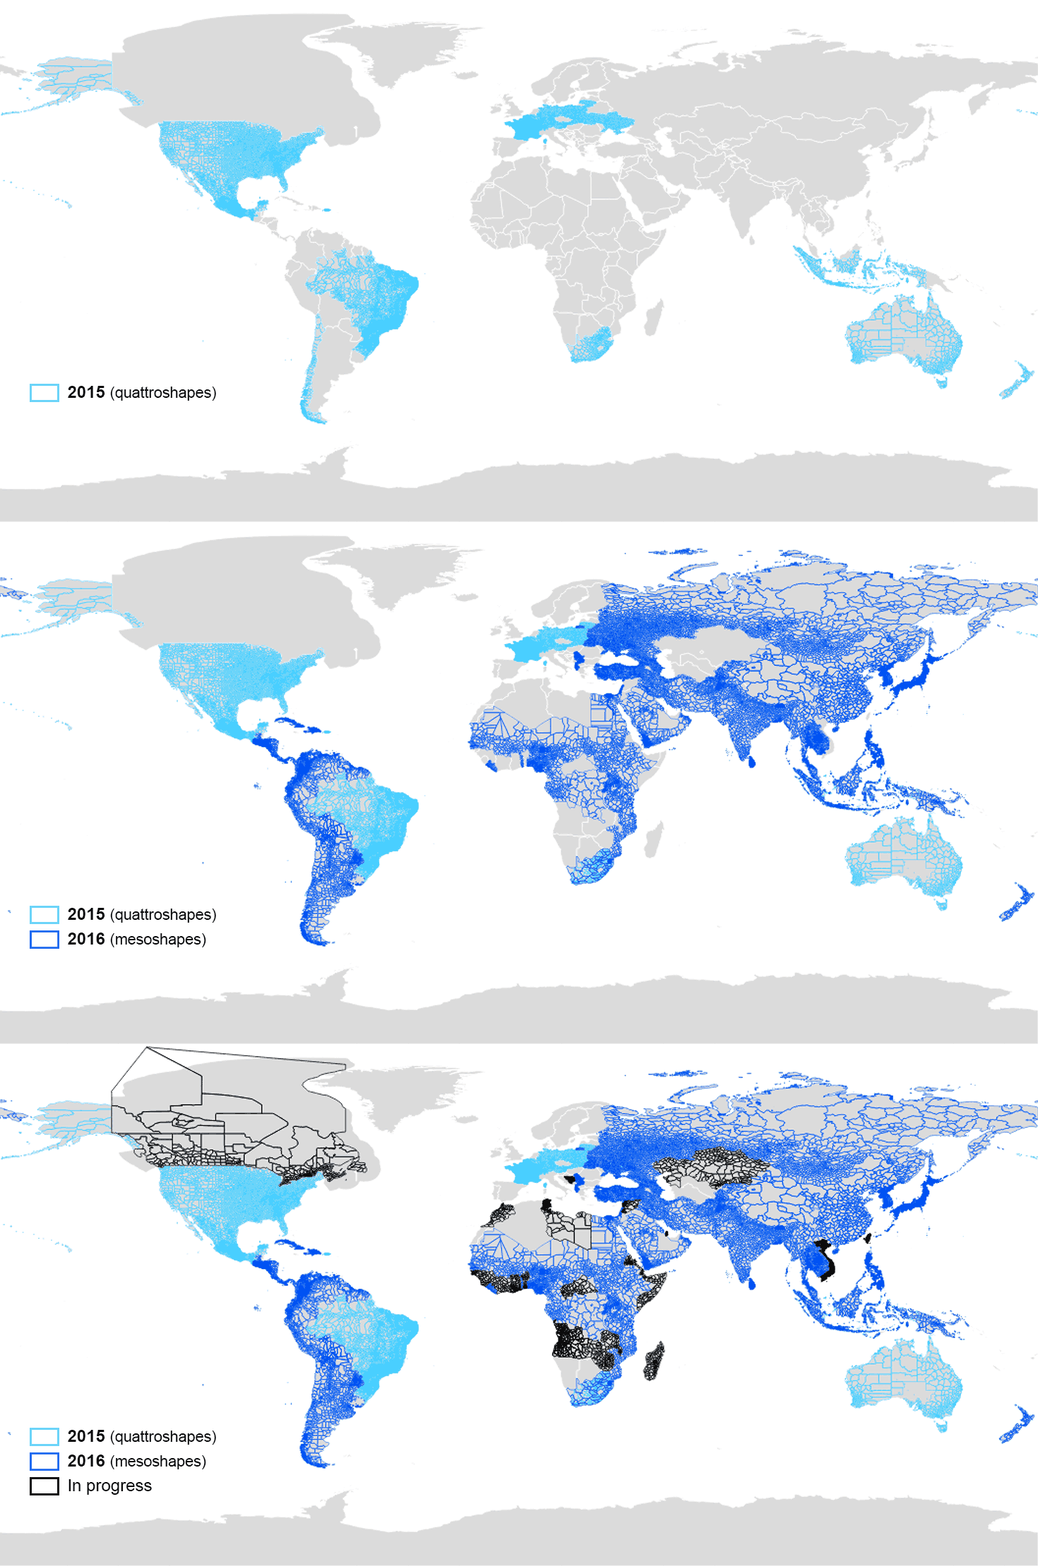
We’ve doubled the number of county features in Who’s On First, a gazetteer of places all based on open data.
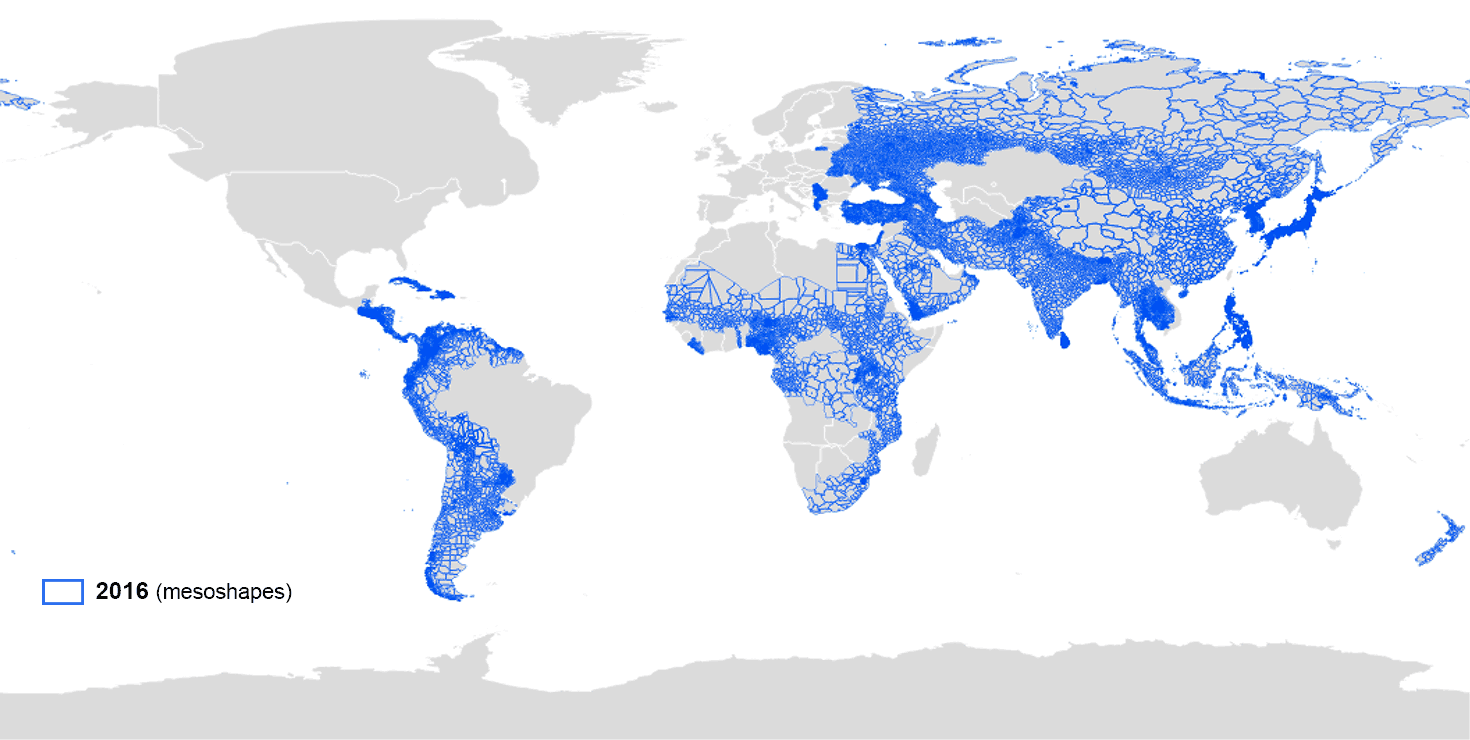
When we first started the gazetteer, 18,214 counties were imported from Quattroshapes, a compendium of open data from national mapping agencies. We’ve grown that number to 41,275 counties in 2016 by adding open data from additional CC-BY sources, and by creating new shapes that Mapzen is releasing as CC0.
We’re on track to having the first high-quality, open-licensed dataset of county polygons that combines global coverage with a permissive license to enable developers to build commercial applications.
Why are county polygons important to Who’s On First?
The goal of Who’s On First has always been to build a gazetteer of places, with each place given a stable identifier and some number of descriptive properties about that location.
The goal of importing new county features is to upgrade shapes for existing places and to achieve global coverage by adding additional places.
Sourcing additional county polygons
In many cases, new county data (somestimes called administrative level 2, or adm-2 for short) was imported from national mapping agencies under a CC-BY compatible license with little to no modification into Who’s On First. (Our collective advocacy for open data is paying off, thank you!)
For example, the Taiwanese government maintains openly licensed geodata for nearly all categorized placetypes in Who’s On First. Once data for Taiwan was retrieved, property names in the source were mapped to standardized Who’s On First property names and imported using the techniques described below.
In other cases, when openly licensed county data could not be found for a country, Mapzen drew polygons to fill in the gaps. To draw these geometries we compared three or more reference datasets to create our own shapes. In keeping with the lineage of alphashapes, betashapes, quattroshapes, zetashapes, and yerbashapes, we call these new geometries mesoshapes, and you’ll see meso in the feature’s src:geom property.
Mesoshapes
When new county polygons were required, Mapzen drew them using a semi-automated GIS process:
- seed a set of points across the entire country
- discard points within a buffer of the reference’s boundary line geometries
- for each point, compare the reference sources to determine if there is consensus about which county the point falls in
- create Thiessen polygons around each consensus point
- dissolve Thiessen polygons based on the consensus county attribute
- generalize the resulting polygon shapes
Some manual cleanup was performed, but not a lot. In our review, areas with good consensus between references on the essential facts will result in good polygons – and this is true for the majority of our results. This process allowed us to import new county polygons for countries that do not currently offer open data.
How were new county polygons imported?
Once new county features were inventoried, an import strategy was needed to handle all geometries, associated properties, and potential conflicts. As a first step, each new county feature was compared to all existing county features for the appropriate country. This was done by:
- Comparing names of the
countyfeature with name properties of existing Who’s On First features. - Ensuring the
countyfeature’s parent (likely a region) matched the existing Who’s On First feature’s parent. Many countries share names among severalcountyfeatures; comparing names and locations are equally important.
If this resulted in no matches, the county feature was imported as a new feature to Who’s On First. If a match was found, the following considerations were needed:
- Adding properties from the new
countyfeature properties to existing Who’s On First record - Retaining existing Who’s On First record properties
- Handling all variations of names and name variants during the merge
- Storing the existing feature’s outdated geometry as an alt-geometry file
- Attaching the new geometry to the existing feature while updating any geometry-related property
Additionally, since we know all new county features are contiguous and inclusive of all counties in a given country, we needed to deprecate any “leftover” features in Who’s On First that did not match any incoming county features.
Comparing records pre-import and post-import
Let’s compare the county features in Afghanistan, pre-import and post-import. Before importing new county geometries, Who’s On First maintained records for 25 counties in Afghanistan, all of which were represented by point geometries. There were 400 new county polygon features created for Afghanistan; each of these features were compared to the 25 existing county records in Afghanistan.
Below, the county records prior to importing counties are shown as yellow points. The new county polygons are displayed as polygons (blue outline). Zoom in to see all new county names, or view full screen.
Prior to the import of new county features, Who’s On First had a total of 8,172 mostly point geometry based county features for the countries included in the first round of countries (added earlier in 2016 and not included in the animated map).
After the import, Who’s On First contains 21,469 county features for those same countries - an increase of 13,297 county features. Forty of these countries had virtually no county coverage in Who’s On First, but now have high-quality county records available for use or download.
In rare cases (including Chile, Indonesia, New Zealand, South Africa, and the Ukraine), the earlier 2015 data was found to be poor-quality and was upgraded with high-quality data.

Next steps…
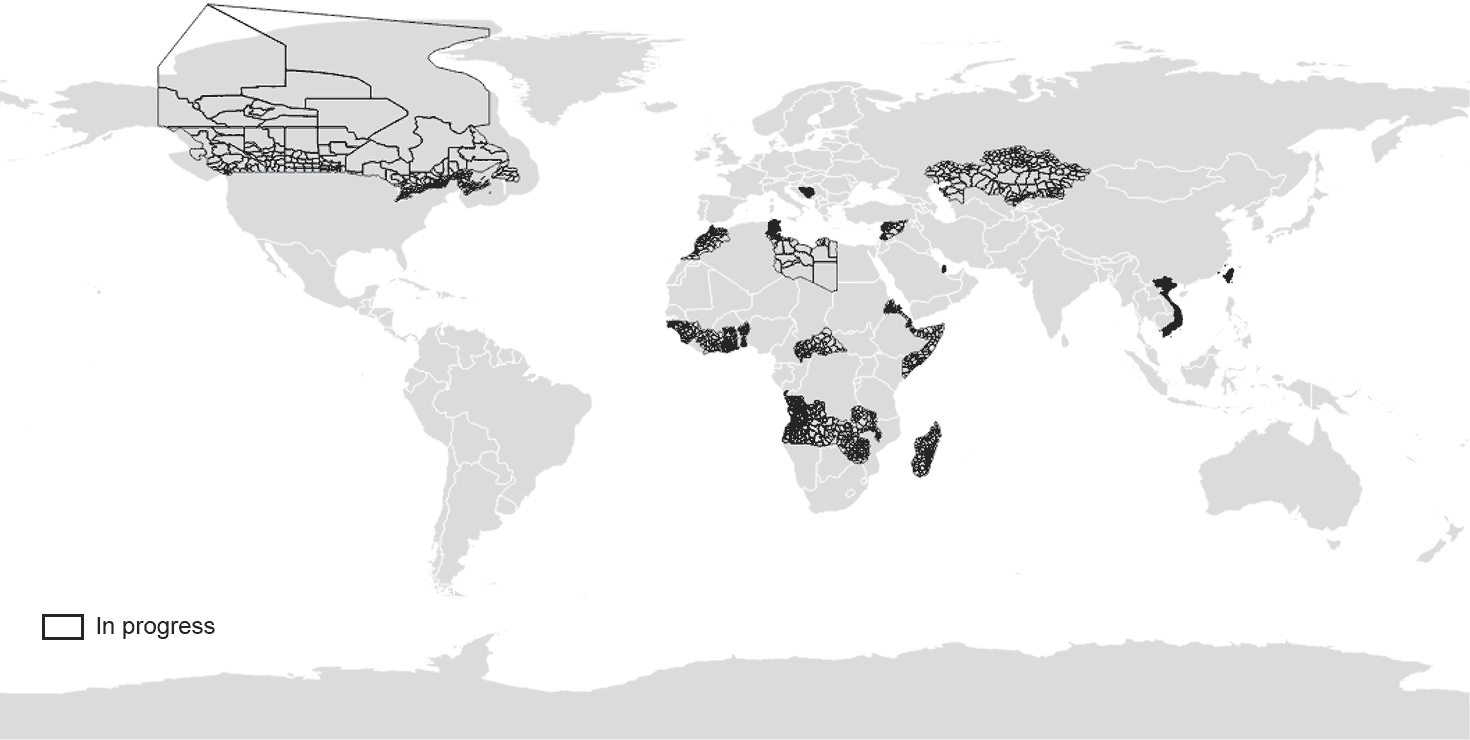
While Who’s On First has already imported a substantial number of new county features, we plan on importing additional county features through early 2017. So far we’ve processed an additional 3,353 features over today’s announcement (show in black outlines on the map below). That leaves Canada and a handful of countries in Africa and Asia (ignoring small island countries for now). In our research we’ve found many European countries skip the county administrative level and go straight to localadmin, but please send us data sources, tips, and corrections!

We found a few other data gems along the way, so expect related improvements to other placetypes including locality and region.
Most new county feature includes a unique Statoids HASC code in their properties. Besides joining the HASC code with demographic tables to create data visualizations, you could use the code to dissolve county geometries into new region polygons that are often better quality than the existing region polygon in Who’s On First. The following HASC codes, as an example, would be used to create the AF.AR region shape (with a little help from QGIS).
AF.AR.EC
AF.AR.PL
AF.AR.FG
AF.AR.RT
And there you have it - new county polygons in Who’s On First! Thanks for reading and stay tuned for the next rounds of new administrative polygons!
Please let us know what you think!
