With the advent of Halloween, what better way to celebrate than with adding an element of spookiness to our tiles with a ghost map?
If you’re not familiar with vector tiles, they’re a way to break up map data into smaller pieces. Each tile represents a portion of the map, and requests are made to a back end service to fetch the data for each tile. Here’s some more details about our own vector tile service
We explored a few different implementation options for making our ghost map:
- Find existing datasets of haunted houses, or other ways to correlate whether a particular feature could be considered haunted.
- Randomly mark a feature as haunted using a deterministic approach from its data.
- Based on OSM’s existing tagset, develop a criteria to define whether a feature should be haunted or not.
Let’s evaluate the different approaches.
Existing datasets
It turns out that there aren’t many good existing datasets out there for haunted places that are easy to import in. Additionally, we’d like a balance of a healthy amount of places being haunted for Halloween, rather than having it be very minimal, or just in focused areas where data exists. Here are some notable links we did find:
- A Wikipedia entry on haunted locations
- This haunted house map
- hauntedplaces.org
- This awesome ghost map from Maptime HRVA
Random spookiness
The idea here was to take some part of the map feature’s data, reduce it to a single value, and given a certain probability, use that to determine whether the feature should be considered haunted. It’s important that this calculation be deterministic and not just totally random, otherwise a feature could toggle its hauntedness with every request. Although this could be a cool feature, ghosts aren’t usually this fluid with their hauntings.
Haunted criteria
Here we define if a feature is haunted based on whether that feature contains certain tags in OpenStreetMap. We felt this was the most flexible, while also being faithful to the data source.
A feature could be a point, line or a polygon. Since we wrote a demo that renders points, we decided to explode the line and polygon geometries to produce a bunch of points. This is the reason you might see a group of ghosts hanging out together at a haunted cemetery. How do we determine if a feature is haunted? Unfortunately OpenStreetMap doesn’t have a haunted tag (although one was proposed). We chose a few different tags. Here’s the sql snippet for our logic:
landuse = 'cemetery'
    OR amenity IN (
    'grave_yard',
    'crematorium',
    'library'
    )
    OR historic IN (
    'tomb',
    'castle',
    'archaeological_site',
    'ruins'
    )
    OR railway = 'abandoned'
    OR name IN (
    'Museo de las Momias de Guanajuato',
    'Weston State Hospital'
    )
Visualizing the data
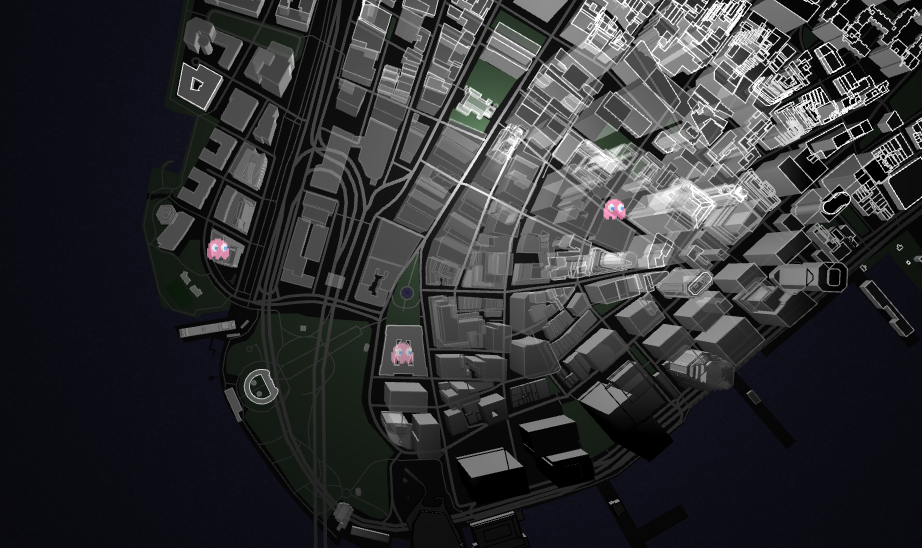
Our ghostmap uses our Tangram library, which uses WebGL to draw vector map data real-time in browsers.
This particular demo uses a sprite drawn using our newly-added texture coordinate functionality, as well as an alpha channel, modulated with a noise function referenced from an external file. (Note: for now, alpha is only available in Tangram’s “alpha-dev” branch.)
The code for this demo is available here.
We’re only going to have the ghost map up on our website for a limited spooky time, so if you want to do more with our spooky styles please check out the repo!
We hope you have fun exploring our spooky tiles and that they give you ideas for other uses of OpenStreetMap data. Happy Halloween!


