A New Look at Maps
Traditionally, maps have been expensive and time-consuming to make, but that’s changing fast. High-quality maps are easier to make every day thanks to OpenStreetMap and modern computer graphics capabilities, and we feel they can be pushed even further with ideas and techniques from 3D animation, video games, and other visual disciplines. To test this theory, the Mapzen graphics team has been working on a mapping library called Tangram.
Tangram is an open-source engine for real-time 2D and 3D maps. We’re writing it around the OpenGL family of graphics languages, starting with WebGL in browsers (soon expanding to OpenGL ES on mobile devices), and integrating it with popular mapping frameworks like Leaflet. Check out our WebGL demo and read on for details.
Many map engines now use OpenGL to render familiar styles of maps, but we think OpenGL can do more. In particular, we’ve been inspired by the map customization demos of design studio Stamen, such as their Toner and Watercolor map styles. However, these maps are generated off-line, and served as static images; to change them, you must modify the style code, and then re-render the images, which can be a slow process.
We’re using OpenGL to draw custom, programmatically-styled maps like these on the fly, which allows many more possibilities for customization, flexibility, and interactivity. We’re big fans of live graphics-editing tools such as Shadertoy, and believe that many of the techniques demonstrated there can be put to practical use in the service of maps.
Mapping libraries generally rely on a lot of assumed limitations to function. The ways colors are set, or lines are drawn, and even things as fundamental as map projection are sometimes hard-coded in, and there’s no way to change any of it without tearing the whole thing down and rebuilding it.
We’re designing Tangram to do all the things you’d expect from a mapping library, but constructed less like a black-box “solution” and more like a set of interlocking pieces, to be taken apart, rearranged, or replaced. Our goal is to make it possible to customize almost every step of the process – from cartography and traditional map styling to 3D geometry, lighting, and rendering. Our team has a wide range of backgrounds, from front-end and video game development to broadcast and feature film production, and we want to bring the same level of control we enjoy in other kinds of graphics tools to mapping.
We don’t think ease of use and control are diametrically opposed. You can get started with Tangram in just a few lines of code, but beyond that, customization and styling control scales with your interest level and experience – you can specify the color of a data layer with a stylesheet, get fancier with JavaScript styling functions, or go crazy and write your own shading effects in GLSL.
Ideally, Tangram will appeal to artists, designers, data visualizers, and coders of all stripes. We’ll be continuing to demo features as we develop them, and we’re especially interested to hear about features or capabilities you’d like to see in a client-side, 3D-capable, open-source mapping platform. We hope the possibilities lead to more exploration, more experimentation, and above all, more useful and beautiful maps.
Follow along at our github repository https://github.com/tangrams/tangram.
On to the demos!
Gratuitous Map Gallery
These map styles are all written in GLSL; they can be referenced from a URL, or written inline in Tangram’s “stylesheet”.
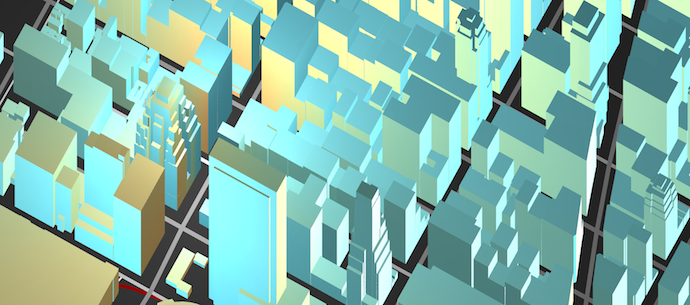
Elevator
This mesmerizing effect modulates the height of all the buildings in the scene by a sine function. This can be accomplished with a single line in the stylesheet:
vertex: position.z *= sin(position.z + u_time) + 1.0;
Windows
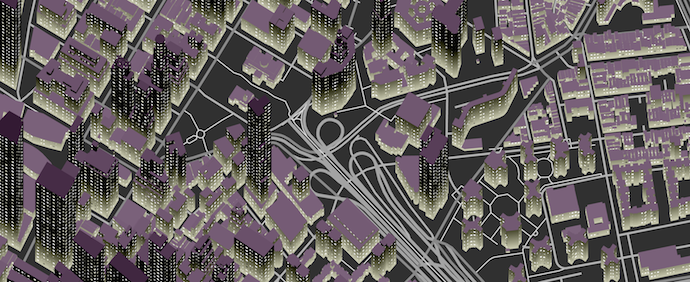
This tribute to SimCity references an external noise module.
globals: |
uniform float u_frequency;
uniform vec3 u_windowColor;
uniform vec3 u_buildingColor;
uniform vec3 u_roofColor;
fragment: |
vec3 vPos = worldPosition().xyz / u_frequency;
// draw repeating bars on all axes, creating darker "window" voids between
vec3 mask = mix(vec3(0.0), vec3(1.0), step(fract(mod(vPos, .9)), vec3(.4, .4, .6)));
// treat brighter areas as building color
if (mask.x + mask.y + mask.z > .5) {
color = u_buildingColor;
color -= vec3(vPos.z * .1); // height factor
// treat darker areas as windows
} else {
// modulate the window color with a noise function
float noiseColor = 2. * noise(worldPosition().xyz * 0.1 + (floor(u_time * 5.) / 10.));
color = u_windowColor * noiseColor;
}
// if the face points up, it's a roof
if (v_normal.z > .6 || v_normal.z < -.6) {
color = u_roofColor;
color -= vec3(vPos.z * .01); // height factor
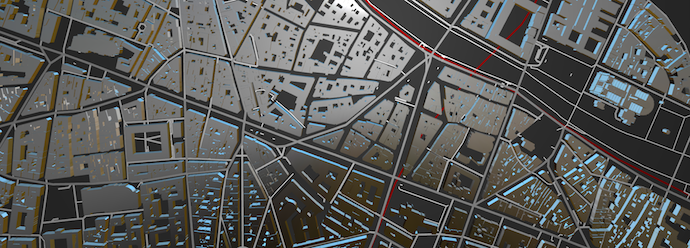
}Halftone
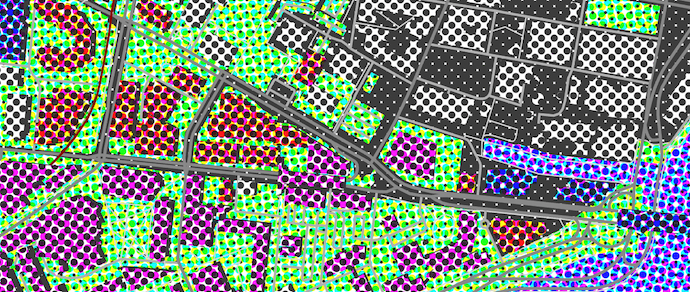
This shader emulates the CMYK-separation halftone printing process. Variables allow adjustments to the scale of the halftone screens, as well as to the dots themselves, which changes the apparent image exposure.
(This shader’s a bit longer, so here’s a link to the code.)
Take a look at our github repository, play with the demo, and get in touch at tangram@mapzen.com if you have questions, ideas or screenshots of your own - we’d love to see what you come up with!

