Trains and buses are cool. They free your attention, widening your experience of a city. The best routes travel through space on dedicated rights of way, avoiding the tedium and frustration of traffic. Transit is also dynamic, a ballet of thousands of vehicles moving to complex schedules, and a good transit map needs a time dimension to reveal hidden networks of speed, frequency, and service. At Transitland, we have built a transit schedule API, a new resource to power routing applications, transit visualizations, and wonderful tools we hope will be realized with community vision.
Ten million tiny movements
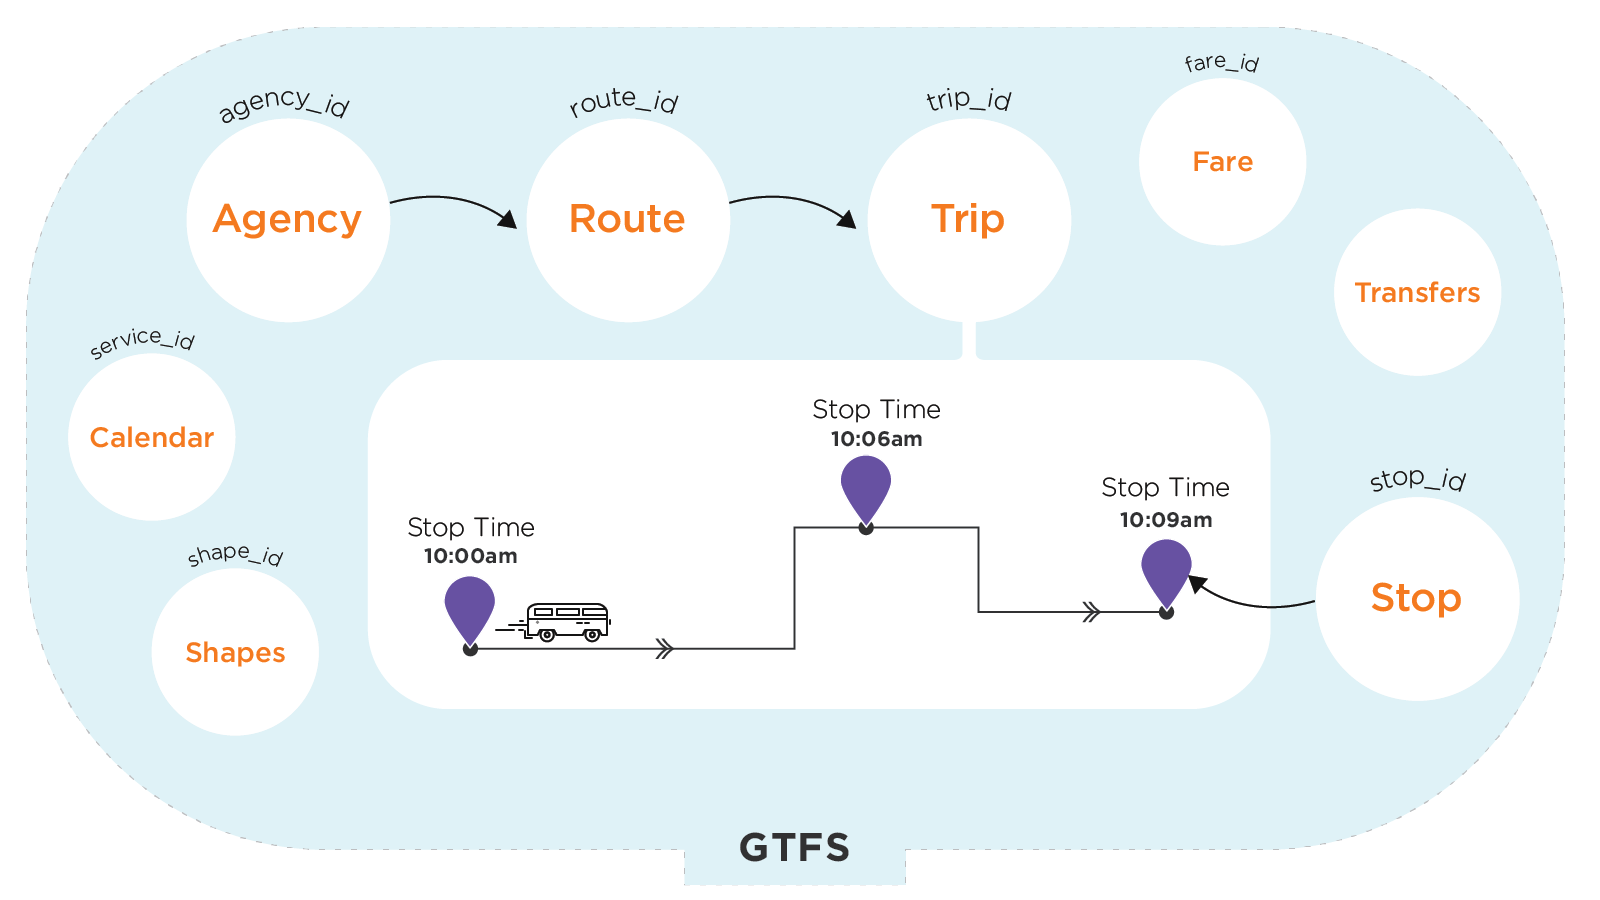
Open transit data comes from a variety of sources, most commonly using the General Transit Feed Specification (GTFS) developed by TriMet and Google in 2005. This collaboration created a versatile specification, balanced between the needs of transit agencies and data consumers. GTFS has added features and extensions over the years, but the core specification is remarkably resilient, and has been widely adopted by hundreds of transit agencies across the world.

GTFS describes a transit system as tables of agencies, routes, stops, and trips that individual transit vehicles make according to a set schedule. Each trip begins at a stop, then visits another stop, and so on, until the trip ends at a final stop. Each stop on a trip, or stop_time, includes an arrival time, a departure time, and accessibility details. This point-to-point representation is intuitive, and easy to describe as a series of rows in a CSV file or relational database.
Transitland schedule API
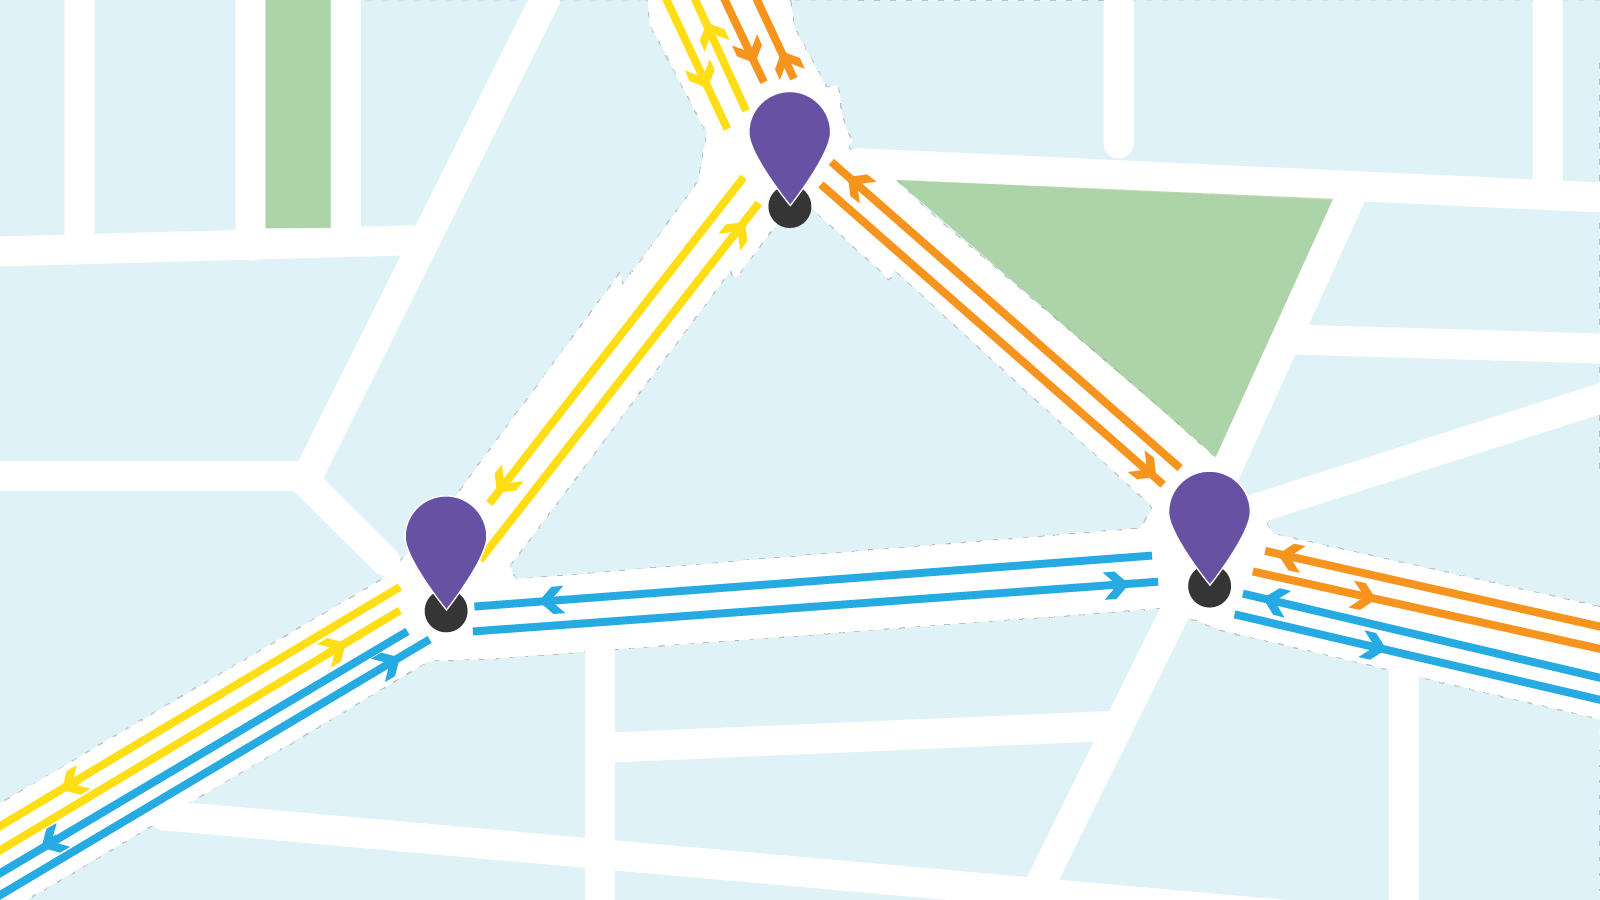
However, there are other useful ways to think about a transit schedule. Fundamentally, transit is about moving between stops as efficiently as possible, and any two stops may have many possible connections — through different routes, at different times of day, using weekends and holidays schedules, etc. The Transitland schedule API transforms GTFS schedule data into a set of connections between stops, representing the transit network as a large directed graph.

In this representation, each possible move between two stops has a unique edge, called a ScheduleStopPair. Each edge includes an origin stop, a destination stop, a route, an operator, and arrival and departure times. Each edge also includes a service calendar, describing which days a trip is possible. Accessibility information for wheelchair and bicycle riders is included, if available. Some of this data is normally split across multiple GTFS tables, but is here denormalized for simpler access: each edge contains enough information to get from one stop to another, to another, and finally to your destination.
Querying the schedule API
The schedule API endpoint allows you to search the graph in several useful ways. For instance, you can request only data within a particular geographic region. Or, for a given day, or time of day, or a specified time period. Fine-grained access to schedule data frees you from having to download, parse, and manage many different GTFS schedules (each of which may have millions of rows) and instead focus on the data most relevant to your application. A few example queries are provided below; please visit the schedule API documentation for additional details.
| Query parameter | Description | Example |
|---|---|---|
| origin_onestop_id | Origin Stop | from Embarcadero BART |
| destination_onestop_id | Destination Stop | to Montgomery St. BART |
| route_onestop_id | Route | on Muni N |
| operator_onestop_id | Operator | on BART |
| service_date | Service operates on a date | valid on 2015-10-26 |
| service_from_date | Service operates on a date, or in the future | valid on and after 2015-10-26 |
| origin_departure_between | Origin departure time between two times | departing between 07:00 - 09:00 |
| trip | Trip identifier | on trip ‘03SFO11SUN’ |
| bbox | Origin Stop within bounding box | in the Bay Area |
Frequency is freedom: an example
Jarrett Walker and many others advocate that frequent service is the foundation of a robust transit network, and critical for rider trust. Yet, frequency information is often missing or obscured on official transit maps, or manually drawn by enthusiasts to fill the gap. A GTFS schedule contains all the data necessary to create a frequent service map, but regional transit service is often split among many agencies and multiple GTFS feeds.

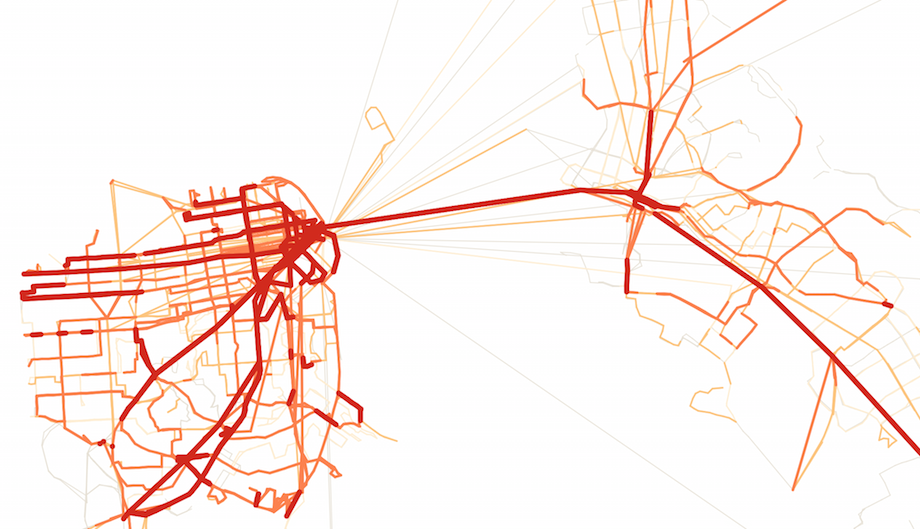
A transit intensity map of San Francisco and Oakland, typical Monday 6-9am peak commute hours. Stronger color and line width represents more frequent service between two stops.
The Transitland schedule API can bridge these gaps, providing the data necessary to analyze complex transit patterns across a large region. I created a Python script to generate the above visualization and serve as an example of the schedule API in action. A combination of query parameters (date, time period, and bounding box) filters the schedule data, and the number of trips between each two stops is counted. The coordinates for each stop are then used to generate a GeoJSON map, with line width and color showing the number of trips per hour.
Explore with us
Hop on the bus and explore the possibilities of a schedule API with us. It’s more fun together! Schedule data for the SF Bay Area feeds and NYC subways is now available for all through the Transitland Datastore API (with more coming soon!) The schedule API documentation and example script provide a few departure points, and we’d love to hear where you’d like to go next.