The development of GTFS (General Transit Feed Specification) over the past 10 years has ushered in a “Golden Age” of open transit data, with adoption by thousands of transit operators across the world. However, as GTFS has spread, a number of questions have arisen about best data practices, how to resolve ambiguities in describing complex transit systems, and how to use GTFS to solve increasingly challenging questions in urban planning and transportation.
Mapzen has been participating in the Rocky Mountain Institute’s collaborative effort to improve GTFS creation practices. To help, we’ve been adding functionality to Transitland to collect information on feeds at scale. Transitland currently includes over 9,600 archived GTFS files from more than 800 sources, and the platform now automatically computes four different types of reports on each of these feed versions:
- Feed statistics
- Service-level histograms
- Google FeedValidator output
- Conveyal gtfs-lib output
These reports are available through the Transitland Dispatcher management interface as well as through the Transitland Datastore API.
Feed statistics
Whenever Transitland fetches a feed, it now summarizes the files present in each archive, the columns in each file, and the values in each column:
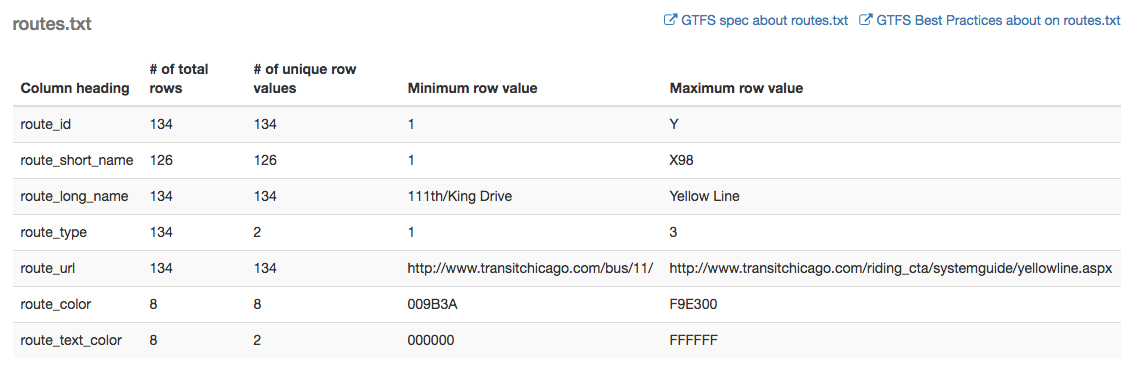
A summary of the contents of the routes.txt file in the Chicago Transit Authority’s feed. Note how 8 of the 134 routes have a color assigned, with 8 unique colors – and 8 routes have a text color assigned, with 2 unique text color values (white and black). View in Dispatcher
From these summaries, it’s possible to quickly spot check for optional columns as well as custom columns that go beyond the spec. This data is also available through the Transitland Datastore API for querying across many feeds simultaneously.
Service-level histograms
Whenever Transitland fetches a feed, it calculates the number of service hours per day. This can be used to generate a histogram showing service coverage for a single feed version:
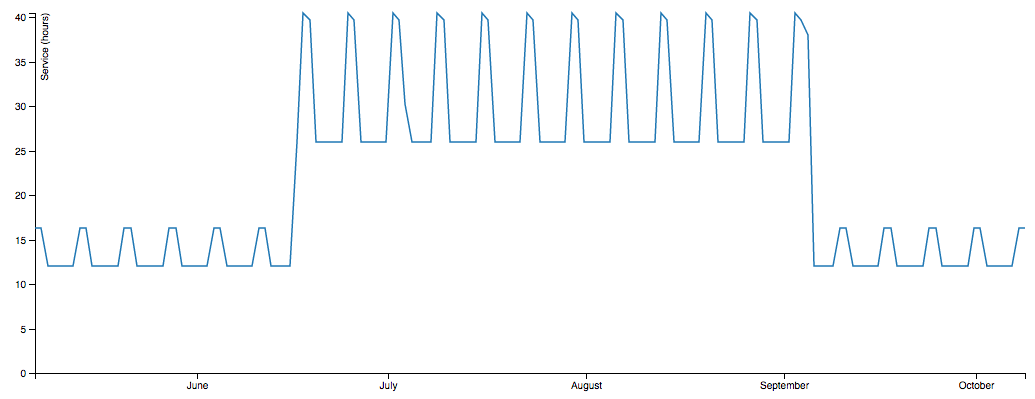
The seasonal service of the National Park Service Boston Harbor ferries, which peaks on weekends. View in Dispatcher
And this can be used to generate histograms showing the extent of service overlap between multiple versions of a feed:
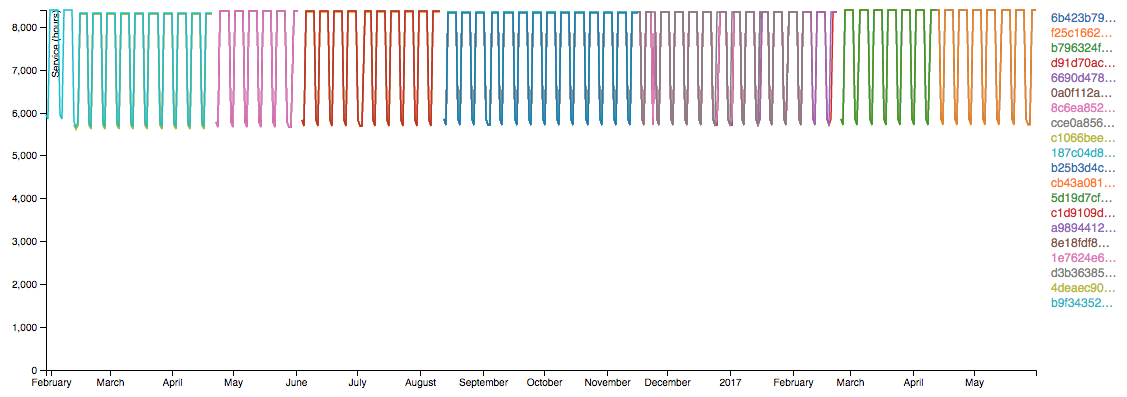
Multiple versions of the San Francisco MTA’s feed over the past year. View in Dispatcher, where you can mouse-over to highlight particular feed versions or check/uncheck feed versions to hide them from the graph.
The service-level counts are available for each day covered by the feed in JSON format, as well, in case you’d like to build your own visualizations or analyses from the Transitland Datastore API.
Google FeedValidator output
When fetching new feed versions, Transitland now runs the Python-based FeedValidator library from Google. Output can be viewed in Transitland Dispatcher (or fetched as HTML page from the Datastore API):
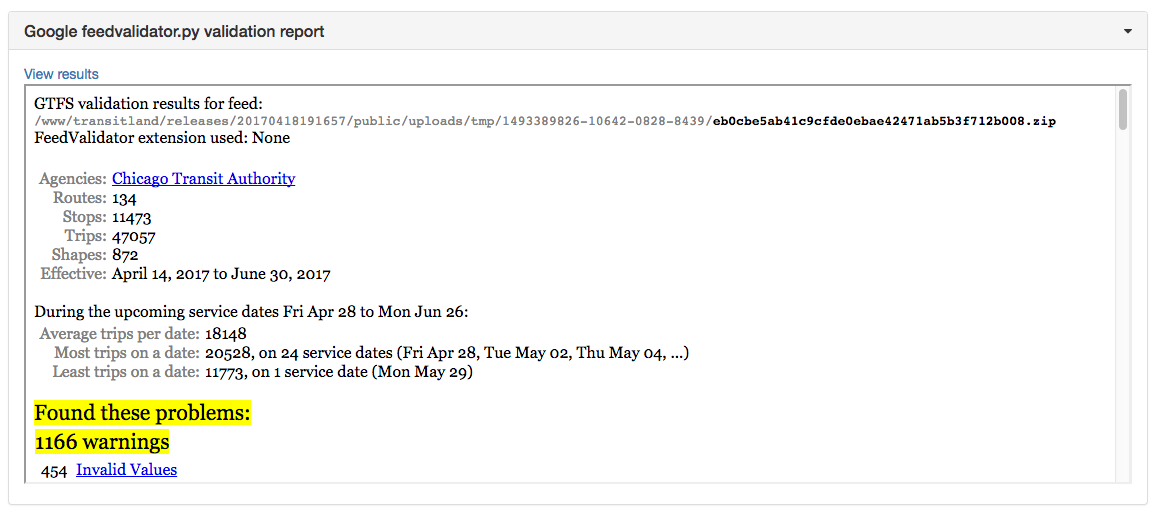
Google FeedValidator output for a CTA feed version. View in Dispatcher
Conveyal gtfs-lib output
Transitland also runs Conveyal’s gtfs-lib and stores its validation results for browsing:
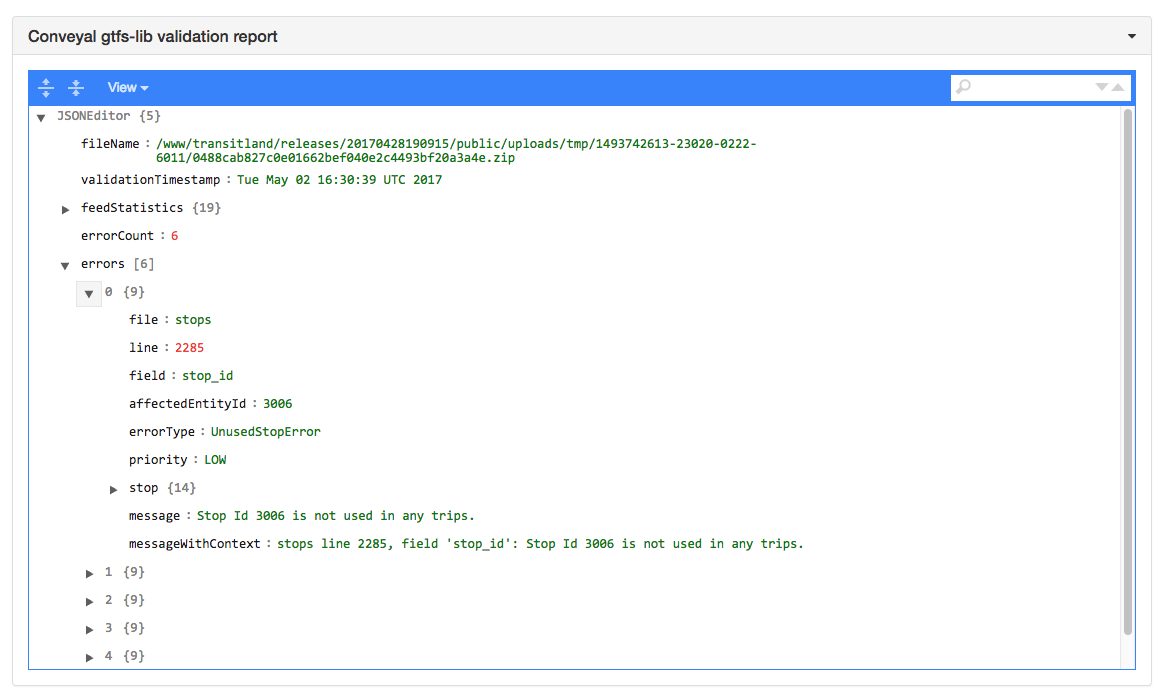
Conveyal gtfs-lib validation output for a Santa Clara County VTA feed version. View in Dispatcher
If you have another analysis or validation library that is open-source, we’re glad to look into adding it the Transitland feed-fetch process. In the absence of a canonical validation library, we’ll run a couple and let users compare output. We’ve also been working on Transitland’s own approach to “quality checks” and “quality issues.”
Don’t see your feed? Please help us add even more feeds to the Transitland Feed Registry — the platform will automatically run the reports on those feeds as well!

