John Muyskens, Armand Emamdjomeh and Faiz Siddiqui of the Washington Post used the Mapzen Mobility isochrone service to estimate commute times in the DC area. They used area the include and exclude features to show how planned transit service reductions will have a heavier impact on lower-income communities.
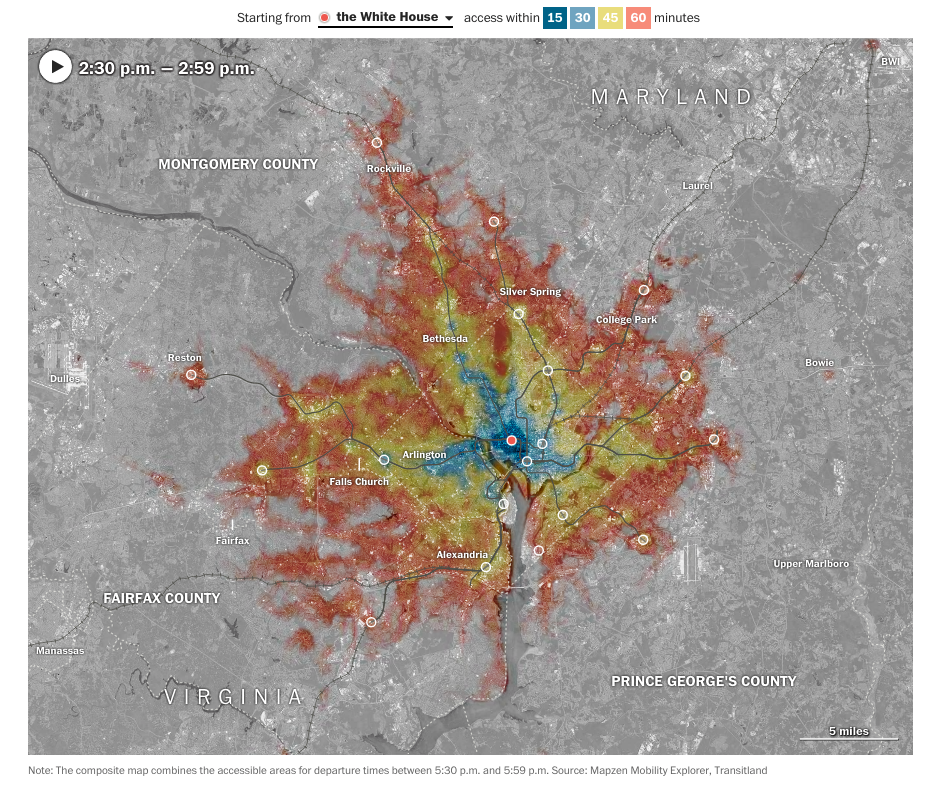
“Here’s where D.C. public transit can take you — and who gets left behind”
..the analysis showed that some of the region’s least-accessible areas also are the most transit-dependent. Northeast and Southeast Washington contain census tracts where more than 40 percent of households are both transit-reliant and lower-income, the only such corridor in the region.
How did they do this?
The Mobility Explorer allows choosing the mode of transit and filtering out transit routes from use in generating isochrones. The rush-hour and late-night isochrones use buses and trains, as well as walking. A second set of late-night isochrones were created, filtering out Metro service.
You can read more on the inequity of distance and commutes in the DC area in their feature article, “When commuting in the D.C. region, distance doesn’t tell the whole story”.
Editing Isochrones
Transportation planners often require tools to analyze and predict the impact of potential changes to the transportation network. These tools are often equipped to handle “what-if” conditions. For example, what is the impact of adding a new road or transit line or what is the impact of removing a transit line, closing a bridge for maintenance?
Real-time additions to transportation networks are often difficult to support, especially for hosted systems like Mapzen’s Mobility services, which support world-wide transportation networks. However, creating mechanisms to remove or temporarily disable specific sections of roadway or transit lines are often possible. We have recently added 2 such features to our hosted Mapzen Mobility services.
The first transportation “editing” feature we have added is the ability to filter or limit the use of various public transit data within routes, time-distance matrices, and isochrones. These filters were discussed in detail in a recent blog post
These filters allow inclusion of a limited list of transit operators, stops, or routes. They also allow exclusion of specific operators, stops, or routes. For example, one could exclude or remove a specific transit line (route) and view the impact via the isochrone service. This is supported within the Mobility Explorer, or a client or user could call the Mapzen Isochrone service and render the GeoJSON directly.
Another editing feature that was recently added is the ability to specify “avoid locations” within the route, time-distance matrix, or isochrone request. These avoid locations are mapped to the nearest road segment (or multiple road segments if the location is at an intersection) and these road segments are disallowed in the result. This can be useful to analyze the impact of a potential bridge closure. The following images show isochrones before and after avoiding the Norman Wood Bridge between Lancaster and York counties in Pennsylvania, which was closed in September 2015. Isochrones allow visualization of the impact to residents who needed to travel to from York county (west side of the Susquehanna River) into Lancaster county. Note that a large power plant is located just south of PA 372 near the bridge employs many people in both sides of the river. Commute times were dramatically increased for some locations (from under 15 minutes to over an hour).
Normal Travel Times
Open this map full-screen, and check out the source in Tangram Play!
This is what an isochrone API call looks like:
https://matrix.mapzen.com/isochrone?api_key=mapzen-xxxxxx&json={"locations":[{"lat":"43.06675586341758","lon":"-89.40384721616283"}],"costing":"auto","denoise":0.3,"polygons":true,"generalize":50,"costing_options":{"pedestrian":{"use_ferry":0}},"contours":[{"time":15},{"time":30},{"time":45},{"time":60}]}
If you add your API key in place of mapzen-xxxxxx, you can see the GeoJSON it returns. (We’ve also cached the response for your convenience.)
You can take this GeoJSON and draw it in many different mapping applications, as we have in Tangram below, or geojson.io, or Leaflet, or CARTO, or or QGIS…
To exclude the Norman Wood Bridge, we add the avoid parameters and the lat/lon of the bridge to the API call:
{"locations":[{"lat":39.795002,"lon":-76.362720}],"avoid_locations":[{"lat":39.815447,"lon":-76.325397}],"costing":"auto"}
Travel Times with Norman Wood Bridge Disabled:
Open this map full-screen!, and check out the source in Tangram Play!
And naturally, here’s a handy comparison GIF:
Isochrones along with inclusion and exclusion are a powerful tool as means of supporting transportation analysis applications. Learn more about them, or drop us a line!
- Introducting Mapzen Mobility Explorer (blog post)
- Mapzen Mobility Explorer
- Transit Inclusion and Exclusion (blog post)
- Introducing Isochrones (blog post)
- Mapzen Isochrone Documentation (docs)


