As your infrastructure grows, you need to know how it’s operating. The second post in our Engineering at Mapzen series gives you a little taste of how we do that here.
Monitoring
A good monitoring solution is, in my estimation, first and foremost flexible. At Mapzen we have a mix of development teams: those who essentially run and manage their own operational deployments, as well as those who rely more heavily on a small operations team, and everything in between. We need to be able to tune any solution to suite a specific team’s needs. Here’s how we do it…
Sensu
Sensu is an incredibly versatile monitoring solution that we rely on heavily. We’ve been running it in production almost from the first day Mapzen opened shop (I’ll take this moment to brag about being employee number two). Sensu has a number of things going for it that led to its selection:
- easy integration with a number of services such as Pagerduty for alert notifications
- a large community that has produced a wealth of code that can extend the system
- easily extensible, it doesn’t force you to write ad hoc monitoring code in any particular language: use ruby, python, bash or anything else your systems support
- it uses a queuing system as the backend for checks, which means we can leverage Elasticache with a Redis backend, and easily scale the systems pulling events off the queue
- it has a simple API that allows us to interact with events (silence, ackowledge or resolve), schedule maintenance to reduce unecessary alerts, and to easily add and remove systems
Here’s a contrived example of a bash script executing a sensu compatible check. It simply counts the files in /tmp and exits with appropriate exit status if either the warning or critical thresholds are breached. The sky’s the limit, simply exit your checks with the appropriate status codes to trigger the desired alert status.
#!/bin/bash

warn_thresh=10
crit_thresh=20
tmpfiles=$(ls -l /tmp/ | wc -l)

if [ ${tmpfiles} -gt ${crit_thresh} ]; then
  echo "Critical: number of files exceeds crit threshold!"
  exit 2
elif [ ${tmpfiles} -gt ${warn_thresh} ]; then
  echo "Warning: number of files exceeds warn threshold!"
  exit 1
else
  echo "OK"
  exit 0
fi
We also run some simple chef code, making use of the sensu-chef cookbook, to add and remove systems as they come online or are removed from service:
Add a client:
sensu_client node[:mapzen_sensu_clients][:sensu_client_name] do
  address       node[:ipaddress]
  subscriptions node[:mapzen_sensu_clients][:subscriptions_array]
  additional(
    keepalive: {
      thresholds: { warning: 180, critical: 300 },
      handlers: node[:mapzen_sensu_clients][:handlers_array],
      refresh: 1800,
      handle: keepalive
    }
  )
end
Remove a client:
http_request 'sensu-remove-client' do
  action      :delete
  url         "http://#{user}:#{secret}@#{node[:sensu][:api][:host]}:#{node[:sensu][:api][:port]}/clients/#{node[:mapzen_sensu_clients][:sensu_client_name]}"
  retries     3
  retry_delay 10
end
Pingdom
Pingdom is a third party service that allows you to run checks on services from all over the world. They’re an old staple, so I won’t go into any detail here. Suffice to say we like the service, but the interface could use some help. If you’re up on any comparable solutions, I’d love to hear your suggestions.
Pagerduty
Pagerduty is another third party service that we leverage heavily. Our company structure is such that we have different teams working on very specific pieces of the mapping stack. Obviously, it isn’t desireable for the Search team to get woken up at 2am for something that’s broken in the Routing stack. Pagerduty’s services, along with Sensu’s flexibility, allow us to ensure that the right people get notified. Pagerduty is the funnel through which every alert we generate flows. Keeping all our alert traffic centralized makes it easier to manage and track.
Metrics
ELK Stack
The Elastic ELK stack probably doesn’t need much of an introduction. Composed of an Elastic backend, Logstash as a log parser/shipper and Kibana as a front end for visualization, we use it heavily to keep ongoing tabs on system health over long periods of time.
Here’s a quick example:
input {
  file {
    type => "pelias-api-logs"
    path => [ "/var/log/pelias-api/current" ]
    tags => [ "<%= node[:mapzen][:environment] %>", "<%= node[:hostname] %>" ]
  }
}

filter {
  # get took_millis from slowlog
  if [type] == "pelias-api-logs" {
    grok {
      match   => { "message" => "%{GREEDYDATA} time elasticsearch reported: %{NUMBER:pelias_api_es_reponse_time:float}" }
      add_tag => [ "pelias-api-es-response-time" ]
    }
  }
}

output {
  zeromq {
    address  => ["tcp://<%= node[:mapzen][:logstash][:host] %>:2120"]
    topology => "pushpull"
  }
}
We run a centralized ELK stack for all our systems, and as you might notice from this client configuration snippet, we use the zeromq output with a couple dedicated logstash processes to service incoming traffic.
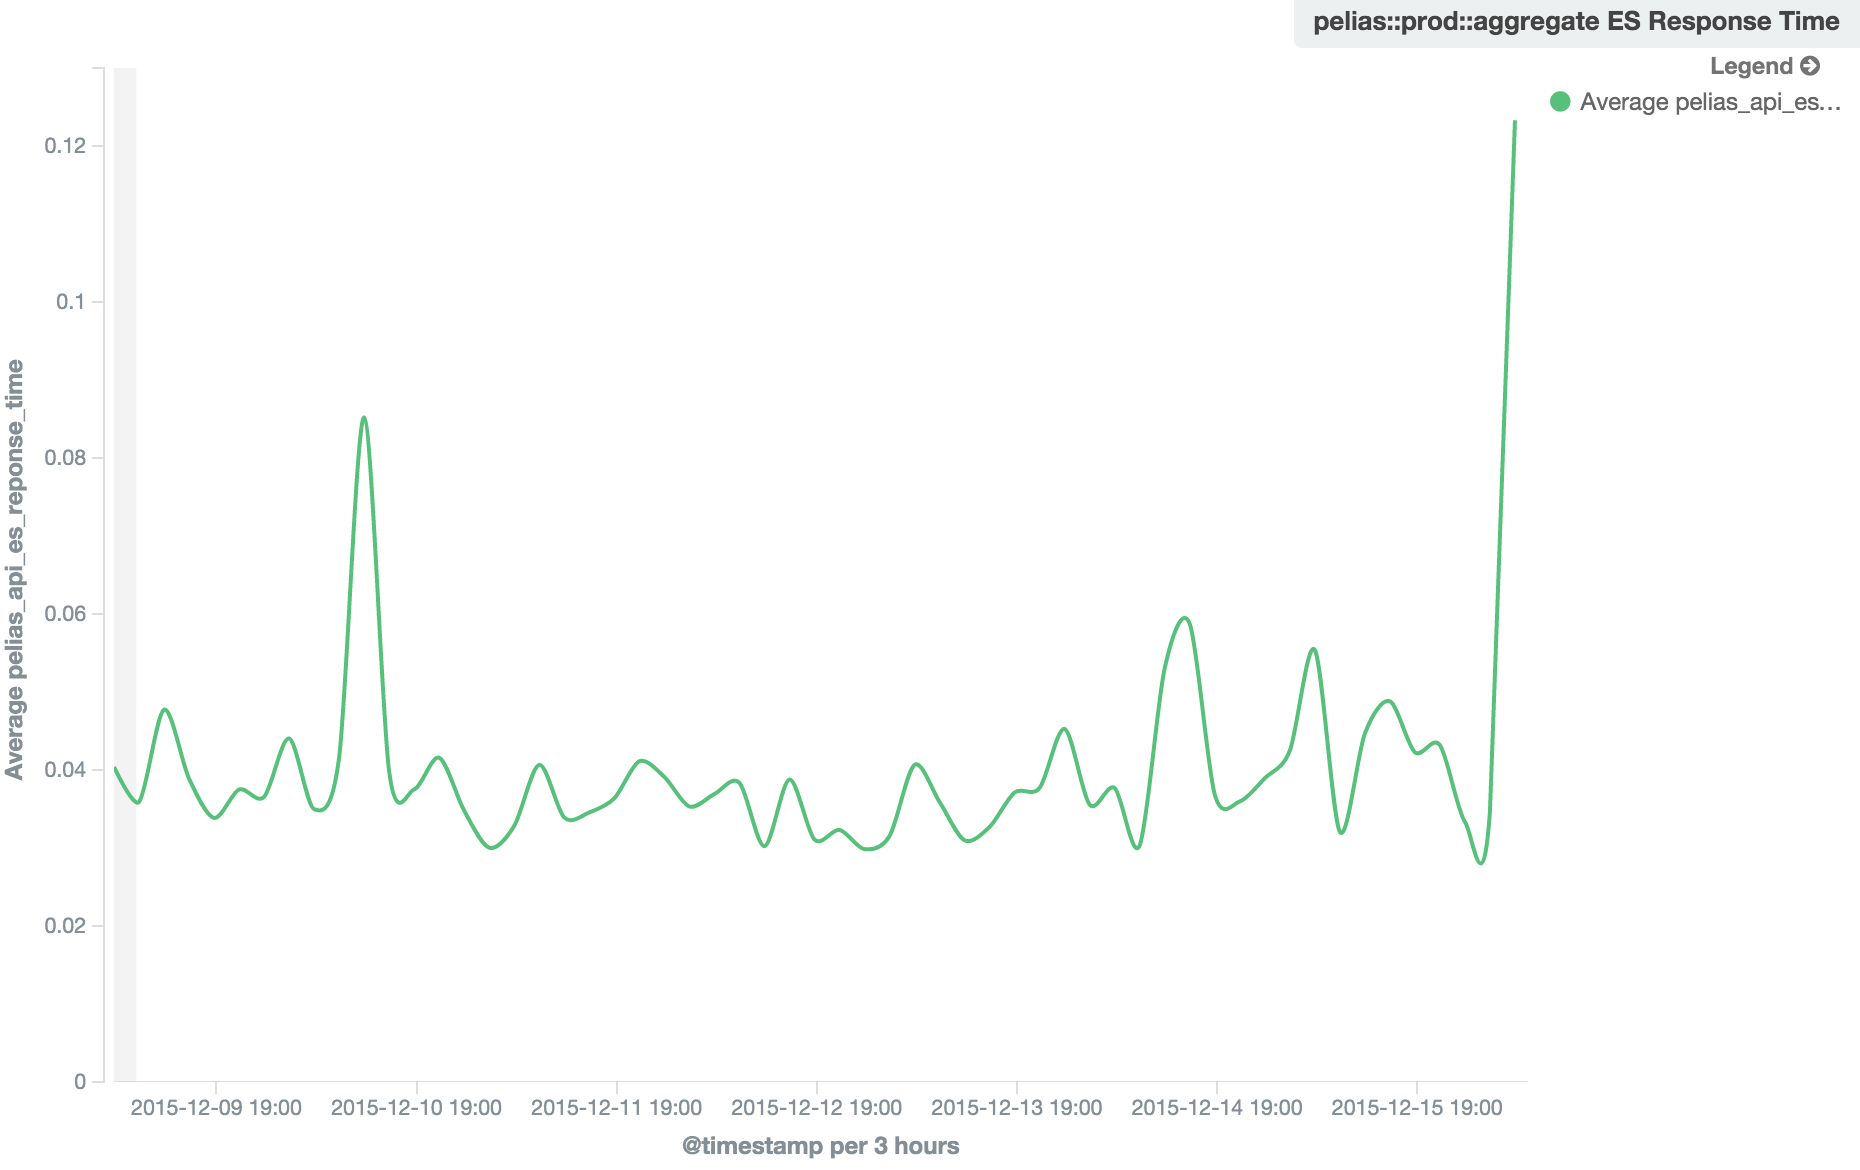
This particular config, used for Mapzen Search, is pulling response time data from the API log and shipping it off. Using this data, we can generate a graph like the one you see below, which helps us track response time performance:
Graphite/StatsD
Another system that probably needs no introduction, Graphite is a bit long in the tooth now, but still a useful tool. Specifically, we use Graphite in conjunction with Sensu to generate alerts off of specific data points. For example, OSM planet update times are shipped off to graphite. We then watch that metric as part of a Sensu check and make sure the time doesn’t rise above a given threshold, after which we generate an alert (or in other cases perform some remediation without ever sending an alert).
Cloudwatch
If it runs on AWS, there’s a Cloudwatch metric for it. Again, we ship any alerts generated here off to Pagerduty.
Closing Remarks
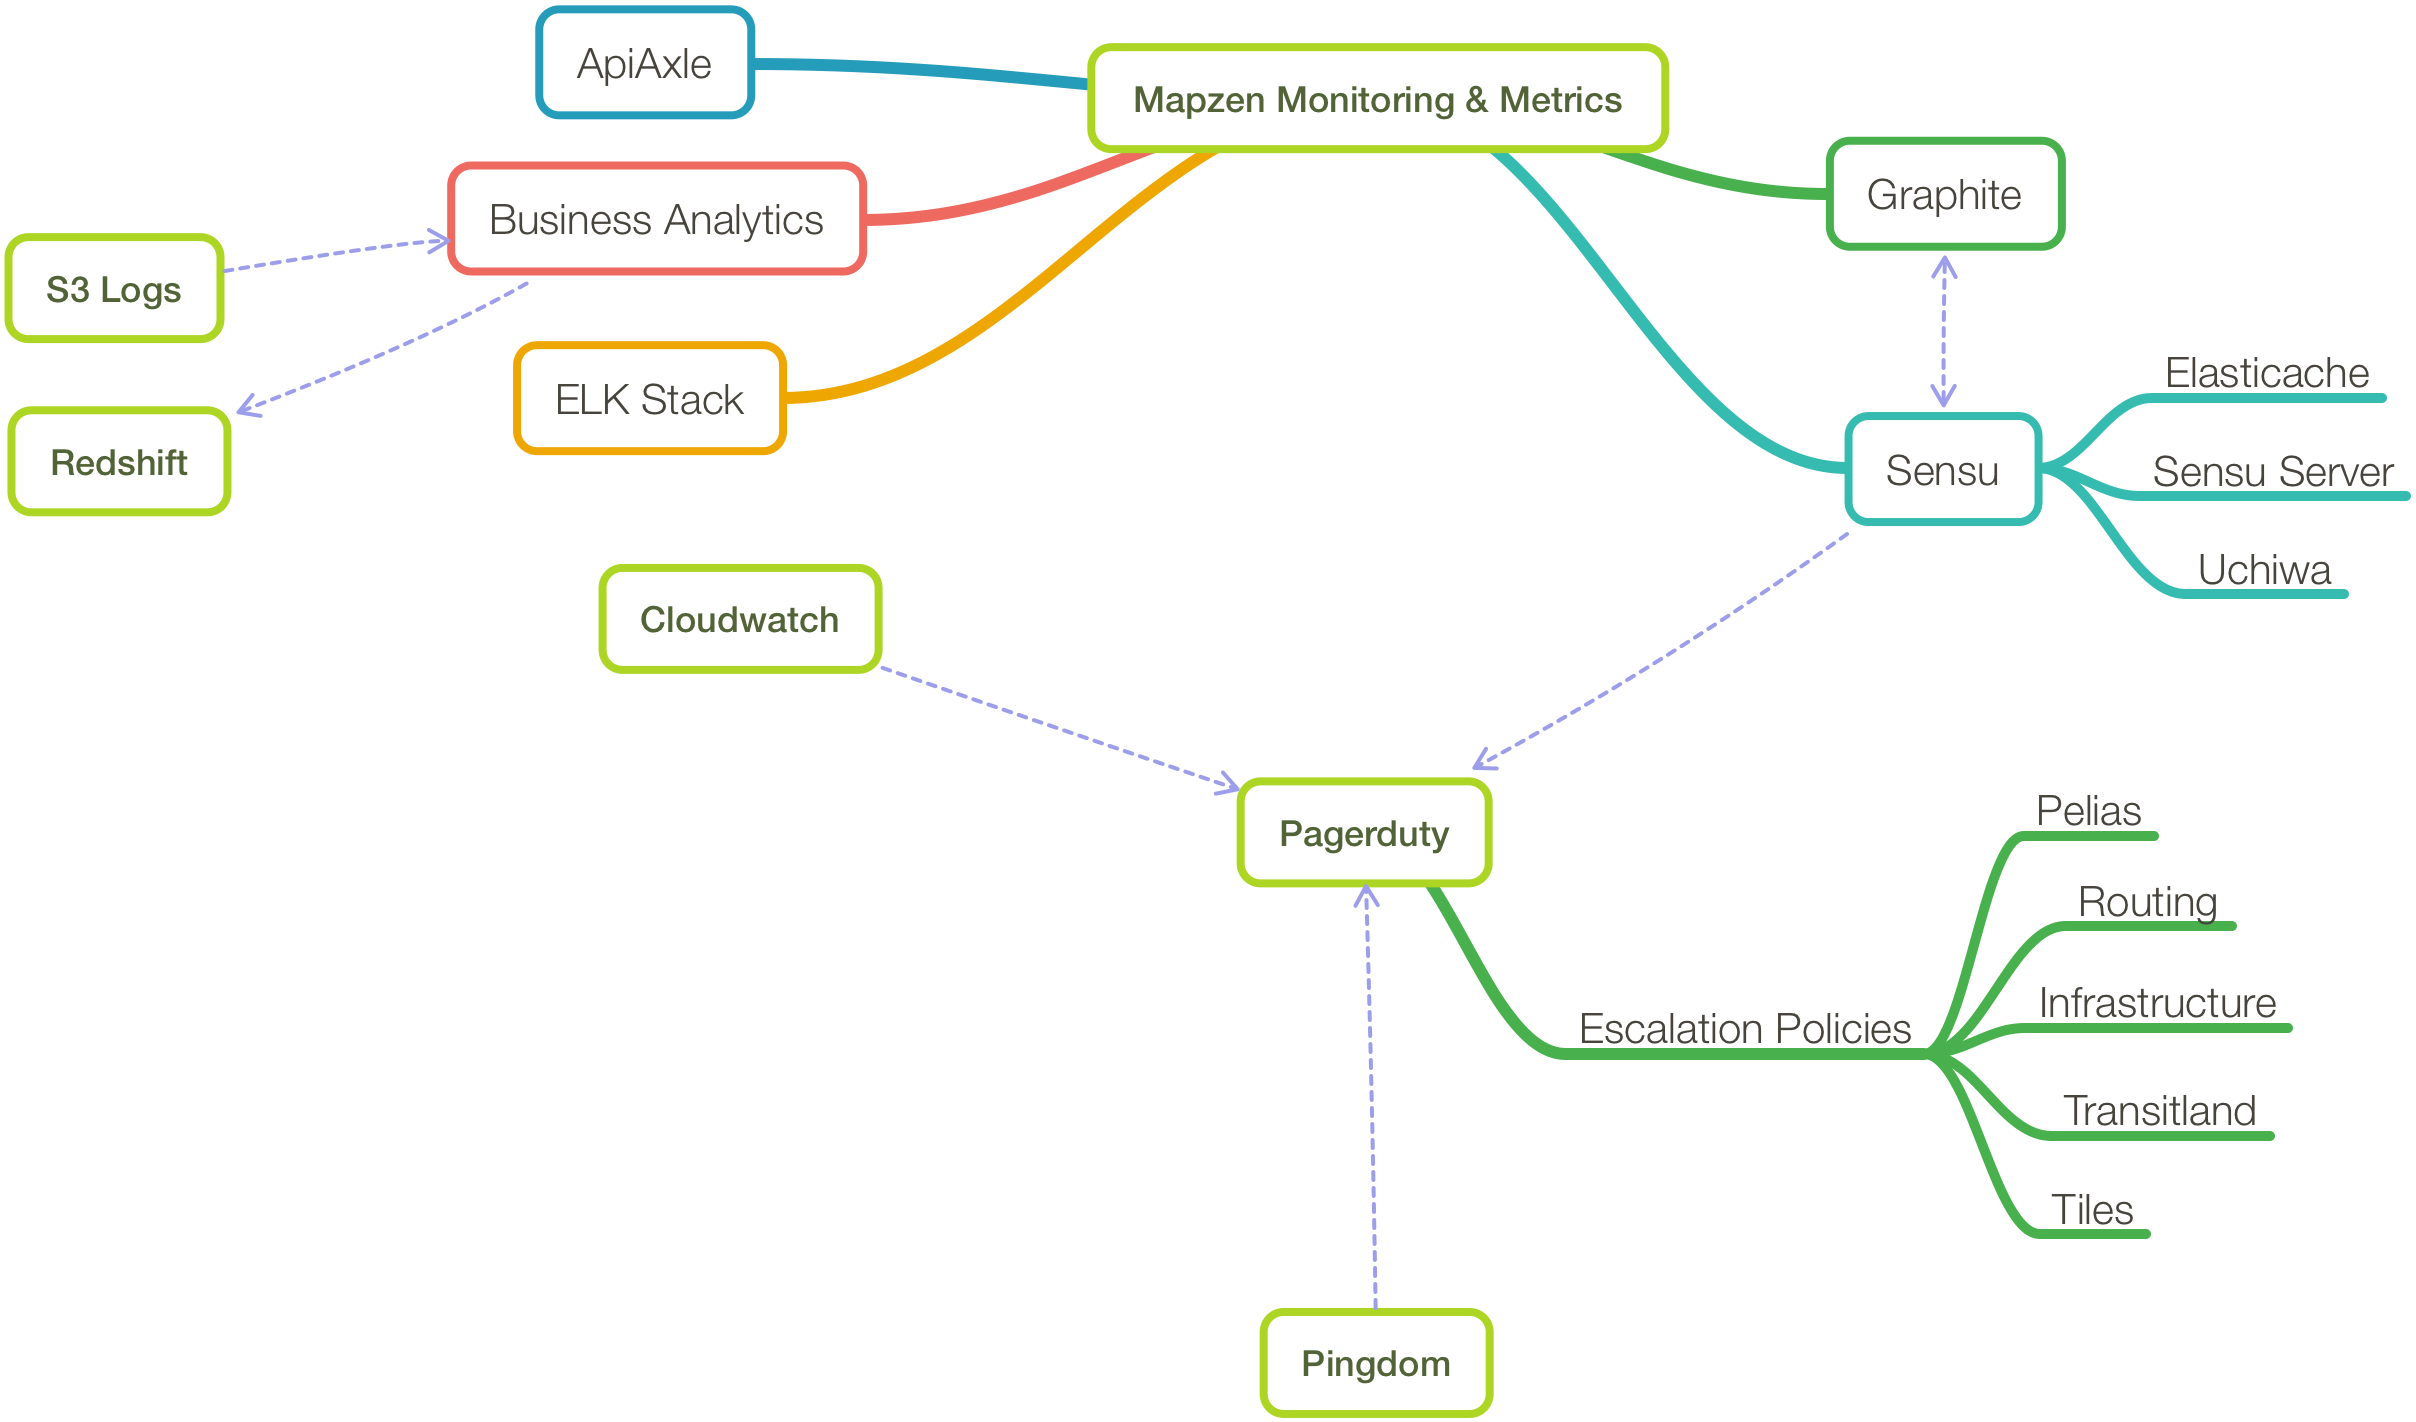
You may have noticed, if you looked closely at the infrastructure diagram up top, that I’ve left a few things off, namely the Business Analytics system and ApiAxle. I’ll leave these as topics for future blog posts. In the meantime, if you’re interested in more detail of the monitoring/metrics system I’ve outlined, get in touch!
If you liked this, check out the first post in the Engineering at Mapzen series about our Search data pipeline and ElasticSearch.
