Hello! And a warm welcome back to another installment of Make Your Own [ ].
I hope you had a chance to drink eat too much, argue visit with family and generally enjoy the holidays. Our office was definitely quiet. (Let’s hear it for grown-up work hours! 👏 )
Well, I am happy to be back and very happy to be making more maps with you.
Today we will finally be leaving our geology map behind and entering the world of dots. Lots and lots of dots, in fact. More than you may even want to know about dots.
Are you excited?
Me too!
Did you want a refresher before we get started? Go ahead and take a look back at some of our previous Make Your Own posts. It’s not a prerequisite, but there are some useful nuggets in there:
Ok, now we’re ready. Let’s go!
Data
I want to show you how to add lots of dots to a map. Not so many dots that we’ll need to resort to tiling or clustering, but still quite a lot of dots.
We’re going to look at the tree-lined streets of San Francisco. Or, at least the trees of those tree-lined streets, anyway. (Khrushchev would be pleased.)
Our street trees dataset comes from the SF OpenData clearinghouse, a great source for data from the City and County of San Francisco.
To get these trees into a Tangram-readable format, I downloaded the CSV, stripped out any unnecessary columns, and converted to GeoJSON using csv2geojson. This is the same tool that powers http://geojson.io/, which I highly recommend if you have a smallish CSV with latitude and longitude data. Not so much for the 116,000+ tree dataset we are trying to convert now. Not that I didn’t try… 😳
Lastly, I minified the converted GeoJSON to bring the size down a few more MB. The dataset is still large (19MB) and best viewed on your laptop/desktop. But by stripping out extra columns and minifying, we were able to bring the final dataset down to less than a quarter of the original GeoJSON size. Woo!
With our conversion done and our GeoJSON in hand, we are ready to make a map!
Points
We’ll be working entirely within a Tangram scene file today, so let’s use Tangram Play. Open up this link in a new tab or window so you can follow along:
https://mapzen.com/tangram/play/#13.0375/37.7613/-122.4296
The only prerequisite for using Play is that our data source is accessible via a public link. For this reason, I put the GeoJSON file up in an S3 bucket (here), but you can throw your data on any cloud storage device that allows you to share links publicly.
~~
I should stop here for just a second to tell you about a problem we’re having. * sigh *
We are experiencing intermittent CORS issues with our s3 resources (including our trees dataset). If you experience any hiccups while working through this example, try refreshing your browser. This typically fixes the issue. If that doesn’t work, try clearing your cache or dropping us a line and we’ll help you debug.
Ok. Back to it. (And sorry for any inconvenience!)
~~
If you’d rather build your map locally, feel free to keep your data local, too. Relative paths are totally acceptable in scene files.
Ok, let’s take a look at Tangram Play. On the left side of the screen you should see a map of San Francisco. On the right, you’ll see our default.yaml file. Go ahead and clear that file and replace with a single line:
import: https://mapzen.com/carto/refill-style/refill-style.yaml
The map on the left should automatically update, showing you the Mapzen Refill basemap.
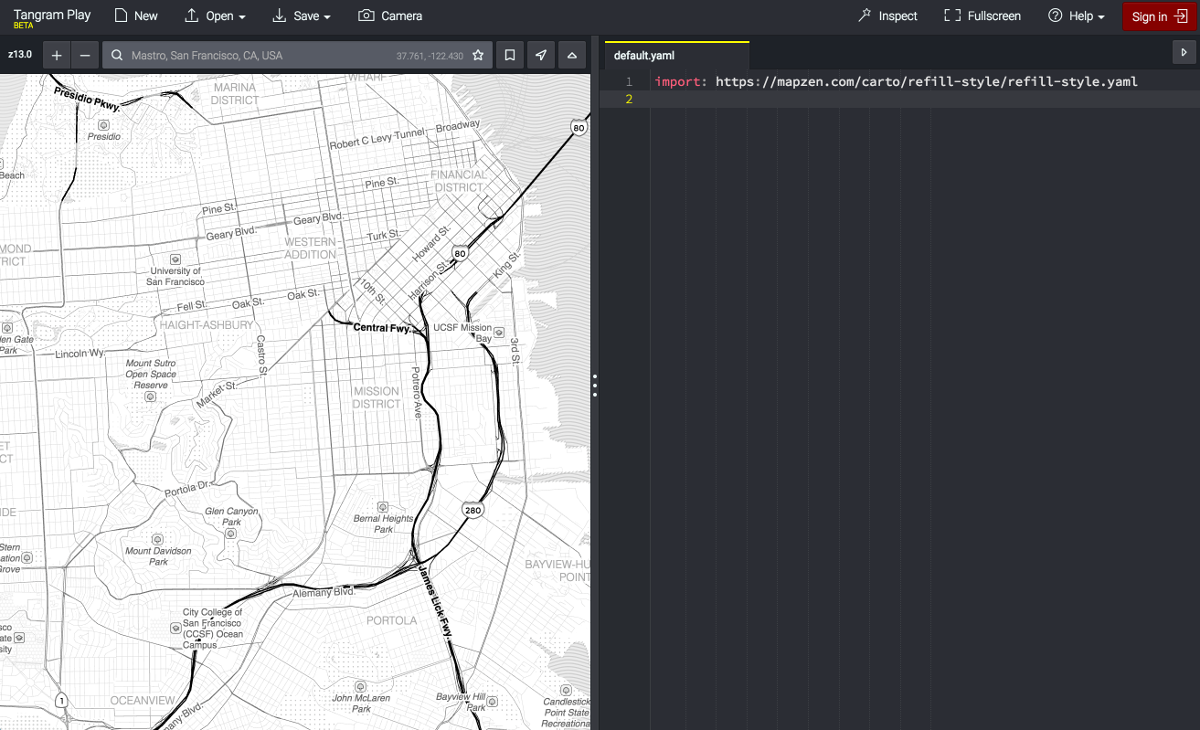
The clean, black and white style of Refill will be a good starting place for our map.
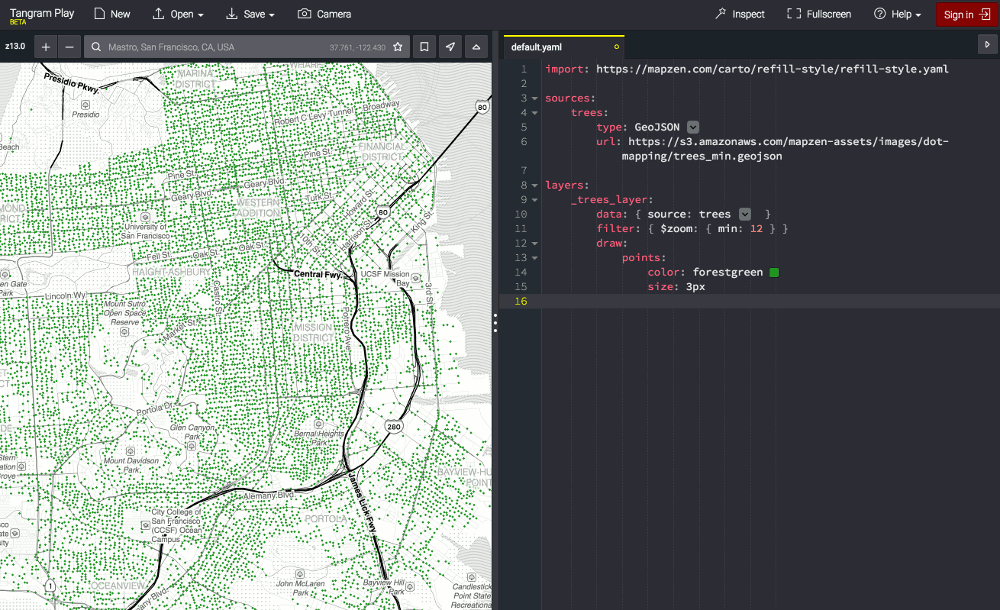
Next, we’ll import our trees data, define the trees layer, and give it a simple style:
sources:
    trees:
        type: GeoJSON
        url: /assets/images/dot-mapping/trees_min.geojson

layers:
    _trees_layer:
        data: { source: trees }
        filter: { $zoom: { min: 12 } }
        draw:
            points:
                color: forestgreen
                size: 3px

Hey! Dots on a map!
Well, that was easy.
We are using one of Tangram’s built-in draw styles called points. The points draw style can be used to draw dots and sprites, or with a custom shader or texture.
In our case, we’re drawing a simple dot to represent almost every tree.
Wait. Almost every tree?
That’s right. At many zoom levels, our points will collide with each other. By default, the points draw style determines that only one point from each of these collisions will be drawn. The winner is decided according to the priority draw parameter.
Rather than limiting the number of points that are drawn, I’d rather show all trees, regardless of collisions. We can do that by setting the collide parameter to false:
        draw:
            points:
                color: forestgreen
                size: 3px
                collide: false
Woa. You can really see those 116,000 trees now, huh?
Let’s add some transparency so we can see the trees that overlap (er, collide).
In Tangram, color can be represented in a wide variety of ways: color names (like forestgreen), hex, rgb/rgba, hsl/hsla, functions, stops, and one more we’ll use now. It’s rgba, but rather than values ranging between 0 and 255, the values range between 0 and 1. This format is used frequently in custom shaders and can be found all throughout the Tangram documentation.
The easiest way to convert other color formats to this RGBA[number, number, number, number] format is by using Tangram Play:
On the color line next to the word forestgreen, you should see a small green square. Click on the square to open the color picker:
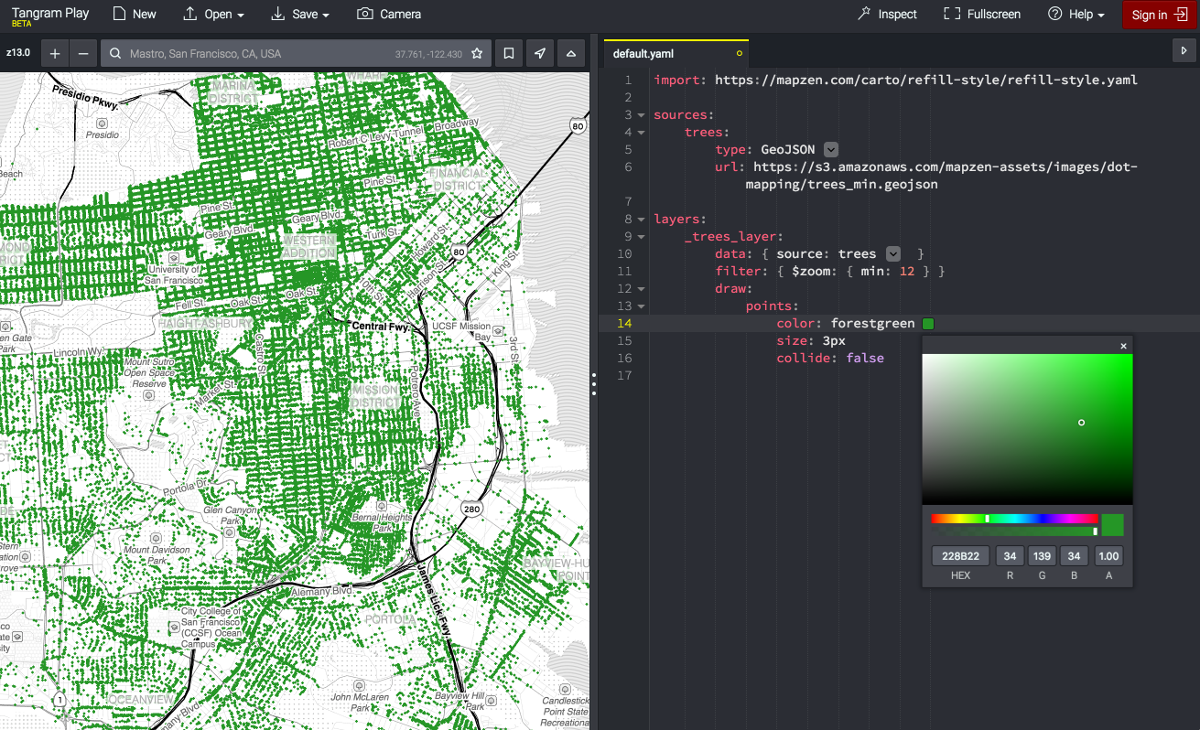
Select a color inside the color picker and close the box. You’ll notice that the color value has changed to the RGBA[number, number, number, number] format. The first three numbers represent red, green, and blue. The fourth is an alpha value.
Change that 1.0 alpha value to 0.5 and watch as our points become semi-transparent.
        draw:
            points:
                color: [0.243, 0.580, 0.243, 0.5]
                size: 3px
                collide: false
Ok, that’s really hard to see with 3px dots. Let’s add some dynamic sizing so that our dots grow as we zoom in.
We’ll use stops, which you may remember from our Map Sandwich post. Stops will change the size of the dot according to our current zoom level:
        draw:
            points:
                color: [0.243, 0.580, 0.243, 0.5]
                size: [[12, 1px], [15, 5px], [18, 14px], [18, 20px], [22, 52px]]
                collide: false
Now, as you zoom in, the dots will grow and you’ll be able to see the overlapping trees:
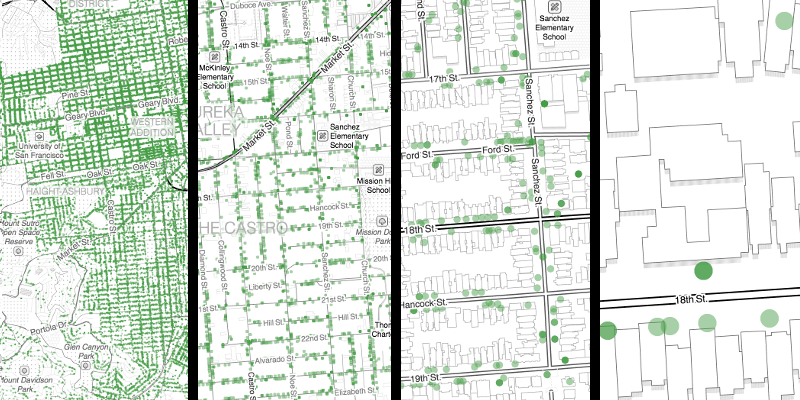
By the way, the two stops at zoom level 18 isn’t a typo. I want my dots to jump up in size at z18, rather than continuing the gradual size increase up to that point. Later on we’ll add icons to those dots, and the size jump will make more sense then.
We can use this same method for color. We’ll make the color a darker, more opaque green the further we zoom in:
        draw:
            points:
                color: [[12, [0.290, 0.604, 0.290, 0.30]], [18, [0.165, 0.478, 0.165, 0.85]]]
                size: [[12, 1px], [15, 5px], [18, 14px], [18, 20px], [22, 52px]]
                collide: false
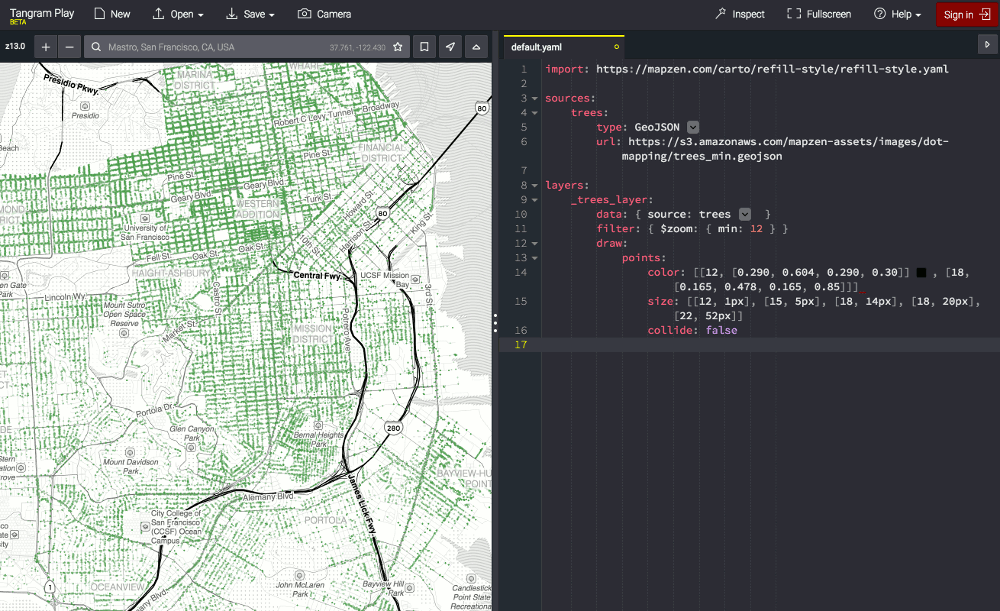
The color change is a subtle difference, but it will help our custom sprites pop when we get to that point.
Let’s do one more thing before we move on to sprites. Let’s filter out all road lines below zoom 18 by adding this layer to the bottom of our scene file:
    roads:
        filter: { $zoom: { min: 18} }
You don’t need to worry about specifying a data source for this layer, because it’s already defined in our imported Refill style. All we’re doing here is overriding the filter for that previously defined roads layer.
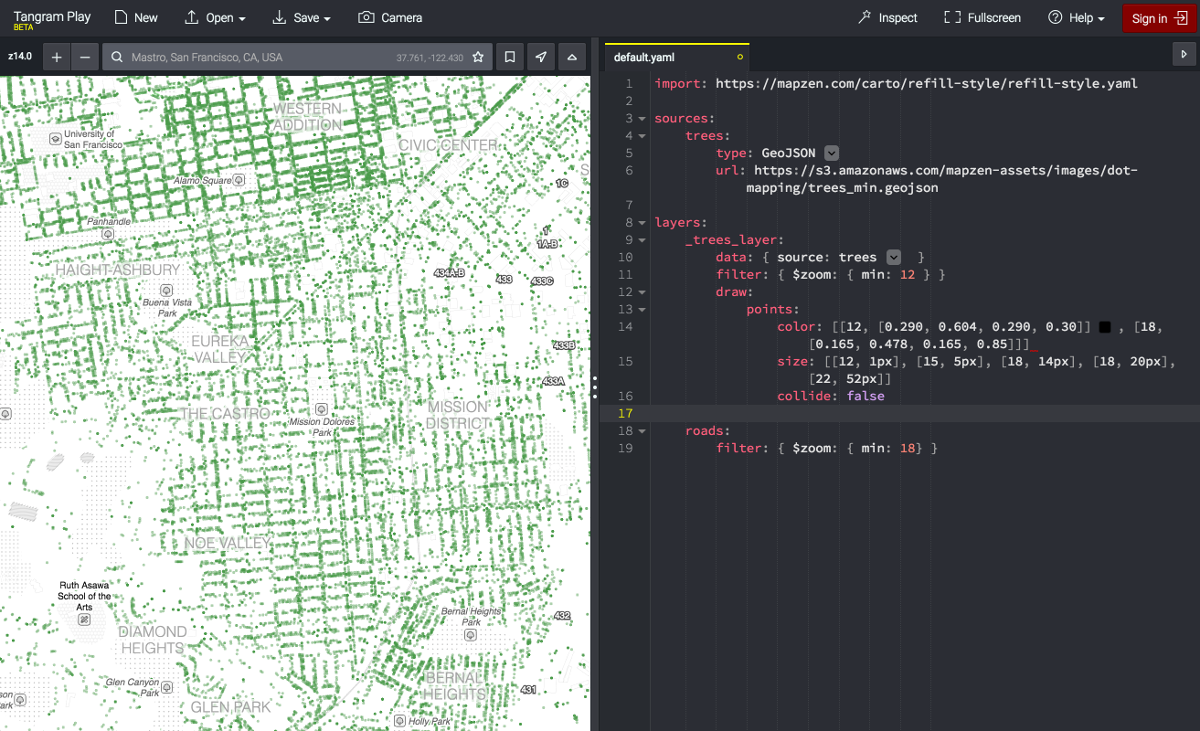
Look, Ma. No lines!
Even with the roads now turned off at low zoom levels, our dense tree data gives a pretty clear picture of where streets run in San Francisco.
Built-in Sprites
Sprites are simply graphics that we can use to represent a location. One way we can do this is by using the sprites that are baked into Mapzen’s basemap styles.
For example, Refill has a custom style called icons, which comes with a set of named sprites. Refill uses the icons style to represent POIs, but we could hijack it for our own data.
Instead of using the built-in points draw style, try using the icons style and referencing one of its existing sprites (a sprite called forest).
        draw:
            icons:
                color: [[12, [0.290, 0.604, 0.290, 0.30]], [18, [0.165, 0.478, 0.165, 0.85]]]
                size: [[12, 1px], [15, 5px], [18, 14px], [18, 20px], [22, 52px]]
                collide: false
                sprite: forest
![]()
Can’t believe I haven’t made a single joke about forest sprites.
There are a lot of sprites baked into Refill: airport, aquarium, bench, candy, deli, ferry, kiosk, peak, manor, museum, ruins, school, subway-entrance, winery, zoo, and many many more. Check out our recently updated icon library for a full list or read on for how to set up your own custom icons.
Custom Icons
Let’s go back to our green dots:
        draw:
            points:
                color: [[12, [0.290, 0.604, 0.290, 0.30]], [18, [0.165, 0.478, 0.165, 0.85]]]
                size: [[12, 1px], [15, 5px], [18, 14px], [18, 20px], [22, 52px]]
                collide: false
I want to turn my green dots into tree icons as I zoom in. To do this, I’m going to layer this white icon over the green dots. Using an icon with a transparent background like this means that if I decide to change the color of my dots, I won’t have to update the color of a static image, as well.
You may remember from a previous post that layering = feature ordering = tricky business.
There are a couple of things to consider when determining feature ordering in Tangram. The first is the type of blend mode used by your draw style. We’re using the points draw style, which has a default blend value of overlay. The overlay mode is helpful in that it allows us to use alpha values (i.e. transparency). However, in this case it is less helpful in that it simply adds our data to the top of all other layers, regardless of the order parameter that we set.
We can get around this in one of two ways:
#1 Change our blend mode to inlay, which allows transparency but also honors ordering. Then we can add an order parameter following this set of global ordering variables.
~ or ~
#2 We can set a blend_order parameter on our draw style. The blend_order controls the order in which styles are rendered. Styles with a greater blend_order value will be drawn on top.
Let’s go with #2 for no reason other than we can do this in fewer lines of code.
Near the top of your scene file, let’s add a custom style we can use for our tree icons:
styles:
    _tree_icons_style:
        base: points
        blend_order: 1
        texture: /assets/images/dot-mapping/tree_white.png
Our new style (_tree_icons_style) will be based on the points style with just two small changes:
First, we set a blend_order of anything higher than 0. (Yep, even a 1 will get the job done.)
Next, we’ll point to the image we want to use for our sprite. We do this using the texture parameter.
Textures are far more than just an image reference. And if you’re interested, I recommend reading up on the different ways textures can be used in Tangram in the Tangram Materials Overview.
For now (and at the risk of upsetting 3D modelers and designers everywhere), you can think of texture as simply the path to our icon image.
Let’s display our icons in a sublayer of _trees_layer called _trees_icon_sublayer. This way, we can filter the icons so that they only show up at zoom level 18 and above:
        draw:
            points: ...
        _trees_icon_sublayer:
            filter: { $zoom: { min: 18 } }
Next, we’ll draw the icons using the new _tree_icons_style we just added. At this point, we’ll also set a dynamic size (keeping them slightly smaller than our green dots) and set collide to false so that all points show up.
        draw:
            points: ...
        _trees_icon_sublayer:
            filter: { $zoom: { min: 18 } }
            draw:
                _tree_icons_style:
                    size: [[18, 14px], [22, 40px]]
                    collide: false
And that’s it! You’ll now have a custom tree sprite that shows up when you zoom in past z18.
Yeah, this is an interactive demo. You can zoom in and out.
Let’s add one last thing to our tree map:
Labels
We first touched on labels in our Put A Label On It post, but that was in the context of adding labels to polygons. Adding labels to points isn’t so different, except for the fact that you’ll need to pay closer attention to collisions. Tangram is careful to avoid collisions between points draw styles. We got around that with our tree points by turning off the collision check (collide: false).
This time, we’ll handle collisions by letting Tangram determine the best placement for the label at various positions around the point.
Yeah, Tangram’s smart like that. :)
But there’s one catch. We can’t use the text draw style we used in our Put A Label On It post because text draw styles also collide with points draw styles. Instead, we’ll be using a text block within the points draw style to “attach” the text to the point.
We could, then, add a text block under our existing points draw style in the _trees_layer. However, because I want to use the same filters as our _trees_icon_sublayer (i.e. only appear at z18 and above), I’m going to add our labels to the icon sublayer.
So, under our _trees_icon_sublayer, let’s add a second draw style called points, to which we can add a text block:
        _trees_icon_sublayer:
            filter: { $zoom: { min: 18 } }
            draw:
                _tree_icons_style:
                    size: [[18, 14px], [22, 40px]]
                    collide: false
                points:
                    text: ...
Next, we’ll set our text_source (a portion of the qSpecies feature property, which I found using the Inspect Mode in Tangram Play) and a font style:
        _trees_icon_sublayer:
            filter: { $zoom: { min: 18 } }
            draw:
                _tree_icons_style:
                    size: [[18, 14px], [22, 40px]]
                    collide: false
                points:
                    text:
                        text_source: |
                            function () {
                                return feature.qSpecies.split(':: ')[1];
                            }
                        font:
                            fill: forestgreen
                            size: 10pt
                            stroke:
                                width: 5px
                                color: white
Finally, to ensure that our icons continue to appear even if there’s no space for a label, we’ll also add the optional: true parameter to our text block. If we were to remove that parameter, any point that cannot display a label (due to collisions) would hide both that label and the icon.
        _trees_icon_sublayer:
            filter: { $zoom: { min: 18 } }
            draw:
                _tree_icons_style:
                    size: [[18, 14px], [22, 40px]]
                    collide: false
                points:
                    text:
                        text_source: |
                            function () {
                                return feature.qSpecies.split(':: ')[1];
                            }
                        font:
                            fill: forestgreen
                            size: 10pt
                            stroke:
                                width: 5px
                                color: white
                        optional: true
And there you have it. Labels!
By the way, if you’d rather have more control over the placement of your labels, check out the anchor and offset parameters listed under Tangram’s text behavior documentation. That also happens to be a great resource for better understanding how points and text relate to one another.
Zoom in to see additional labels appear.
The full code for this exercise can be seen on bl.ocks.org. You can also view and modify the final scene file using Tangram Play.
An interactive version of this map is also available. (Since San Francisco loves pop-ups, we added a few. Some trees have a surprise.)
If you have questions or want to show off something you’ve made with Mapzen, drop us a line. We love to hear from you!
Dots image courtesy of the Tootsie Company via Business Insider.
Check out additional tutorials from the Make Your Own series:
