Hello again!
We’re back with the fourth installment of Make Your Own [ ]. Today, we’ll be focusing on how to add labels to your map using mapzen.js and the Tangram scene file.
We are going to begin right where we left off last time, so if you haven’t yet read the first few posts, I recommend starting there:
Once again, I’m going to assume you have a text editor and access to a web server. If you need either, please read our developer guide on setting up a bare bones development environment or use the gist → bl.ocks workflow described in One Minute Map.
Ok, let’s get started!
Here’s a reminder of what our geology map looks like from the last post:
Looks pretty good, no?
Buuuut…. it’s maybe not the most helpful map I’ve ever made. (What do these colors even mean?!) Sure, we could slap on a legend, but I’d like to do one better. Let’s add labels to the geologic units. That way we’ll have a better idea of what we’re looking at.
We’ll start where we left off last time, with index.html:
<!DOCTYPE html>
<html lang="en">
  <head>
    <title>San Juan Island Geology</title>
    <meta charset="utf-8">
    <link rel="stylesheet" href="https://www.nextzen.org/js/nextzen.css">
    <script src="https://www.nextzen.org/js/nextzen.min.js"></script>
    <style>
      #map {
        height: 100%;
        width: 100%;
        position: absolute;
      }
    html,body{margin: 0; padding: 0}
  </style>
  </head>
  <body>
    <div id="map"></div>
    <script>
      // Mapzen API key (replace key with your own)
      // To generate your own key, go to https://mapzen.com/developers/
      L.Mapzen.apiKey = 'mapzen-JA21Wes';

      var san_juan_island = [48.5326, -123.0879];

      var map = L.Mapzen.map('map', {
        center: san_juan_island,
        zoom: 12,
        scene: 'scene.yaml',
      });

      // Move zoom control to the top right corner of the map
      map.zoomControl.setPosition('topright');

      // Mapzen Search box (replace key with your own)
      // To generate your own key, go to https://mapzen.com/developers/
      var geocoder = L.Mapzen.geocoder('mapzen-JA21Wes');
      geocoder.addTo(map);
    </script>
  </body>
</html>
and scene.yaml:
import: https://mapzen.com/carto/walkabout-style/3/walkabout-style.zip

styles:
    _alpha_polygons:
        base: polygons
        blend: multiply
    _dashed_lines:
        base: lines
        dash: [3, 1]
        dash_background_color: rgb(149, 188, 141)

sources:
    _nps_boundary:
        type: GeoJSON
        url: https://gist.githubusercontent.com/rfriberg/684645c22f495b4a46f29fb312b6d268/raw/843ed38a3920ed199082636fe198ba995f5cfc04/san_juan_nhp.geojson

    _nps_geology:
        type: GeoJSON
        url: https://gist.githubusercontent.com/rfriberg/3c09fe3afd642224da7cd70aff1c1e70/raw/1f1df59f4cb4e82d7ea23452c789bc99c299a5cb/san_juan_nhp_geology.geojson

layers:
    _national_park:
        data: { source: _nps_boundary }
        draw:
            _dashed_lines:
                width: [[8, 0.5px], [18, 5px]]
                color: '#518946'
                order: global.sdk_order_over_everything_but_text_1

    _geology:
        data: { source: _nps_geology }
        filter:
            all:
                - { $zoom: { min: 10 } }
                - not: { GLG_SYM: water }
        draw:
            _alpha_polygons:
                order: global.sdk_order_over_everything_but_text_0
                color: |
                    function() {
                        // Note: this is a block of JavaScript so we can use JS comment syntax
                        var category = feature.GLG_SYM;
                        var color = category == 'Qa'       ? '#FFF79A' :
                                    category == 'Qb'       ? '#FFF46E' :
                                    category == 'Qd'       ? '#fff377' :
                                    category == 'Qf'       ? '#dddddd' :
                                    category == 'Qp'       ? '#EAC88D' :
                                    category == 'Qgdm'     ? '#FCBB62' :
                                    category == 'Qgdm(es)' ? '#FEE9BB' :
                                    category == 'Qgdm(e)'  ? '#E8A121' :
                                    category == 'Qgom(e)'  ? '#EAB564' :
                                    category == 'Qgom'     ? '#FECE7A' :
                                    category == 'Qgd'      ? '#FEDDA3' :
                                    category == 'Qgt'      ? '#FCBB62' :
                                    category == 'KJmm(c)'  ? '#86C879' :
                                    category == 'KJm(ll)'  ? '#9FD08A' :
                                    category == 'JTRmc(o)' ? '#27BB9D' :
                                    category == 'TRn'      ? '#ED028C' :
                                    category == 'TRPMv'    ? '#F172AC' :
                                    category == 'TRPv'     ? '#F499C2' :
                                    category == 'PDmt'     ? '#40C7F4' :
                                    category == 'pPsh'     ? '#9BA5BE' :
                                    category == 'pDi'      ? '#848FC7' :
                                    category == 'pDit(t)'  ? '#B28ABF' :
                                    '#000';

                        return color;
                    }
UPDATE March 1, 2017: A Mapzen developer API key is now required for mapzen.js. We’ve updated the Make Your Own series to include a demo key. Generate your own free API key at https://mapzen.com/developers/.
Layer or Sublayer
As you can see above, our scene file has two layers: _national_park (San Juan National Historic Park boundaries) and _geology (San Juan geologic units).
One option for drawing our labels would be to add a third layer to our scene file. Something along the lines of:
    _geology_labels:
        data: { source: _nps_geology }
        draw: ...
However, because we are using the same data source as our _geology layer, we could turn our layer into a sublayer of _geology. The sublayer will inherit both the data source and the filter that we set up for our _geology layer, which will effectively reduce the number of parameters we need to set. (#winning)
Ok, so let’s call our sublayer “_geology_labels” and insert it within the _geology layer, just below the draw block. I’ll add a comment to make it a little easier to follow:
    _geology:
        data: ...
        filter: ...
        draw: ...

        # Labels sublayer
        _geology_labels: ...
Labels
To draw our labels, we’ll be using one of Tangram’s built-in draw styles called text. The text draw style will draw a text label at a given point, depending on the type of data that is provided. For point data, the label will be drawn at the point. For lines, the label will be drawn along the line. And for polygons (like our data), text will be drawn within the polygon at regular spacing or at the polygon’s centroid. (More on that shortly.)
To our scene file, let’s add a simple, black label:
    _geology:
        data: ...
        filter: ...
        draw: ...

        # Labels sublayer
        _geology_labels:
            draw:
                text:
                    text_source: GLG_SYM
                    font:
                        fill: black
                        size: 12px
We’re using the text_source parameter to set the source of the label text. This could be a function (that returns a string) or the name of a feature property. If you recall from our last post in the series (Filters and Functions), each of our GeoJSON features comes with a set of feature properties:
{
    "type": "Feature",
    "properties": {
        "FUID": 1,
        "GLG_SYM": "KJmm(c)",
        "SRC_SYM": "KJm(c)",
        "SORT_NO": 13.0,
        "NOTES": "NA",
        "GMAP_ID": 74832,
        "HELP_ID": "KJmm(c)",
        "SHAPE_Leng": 137.95199379300001,
        "SHAPE_Area": 954.47301117400002
    },
    "geometry": ...
}
These properties are accessible to a few different blocks, including filters and text_source. In this case, we’re telling Tangram to show the value stored in the feature property "GLG_SYM" as the text for our label.
If you’ve updated your map, it should look something like this:

There are several text parameters we can use to modify our labels, but the only parameter that needs to be set is font. So far, we’ve set our label size and color, but let’s take a look at some of the other font parameters we can use to improve the look of our labels.
Let’s change our font weight to bold and update the color of our text to something that blends a little better: rgba(130, 84, 41, 0.9). We’ll also change our fixed size to a dynamic size using stops (which you may remember from our Map Sandwich post):
              text:
                  text_source: GLG_SYM
                  font:
                      fill: rgba(130, 84, 41, 0.9)
                      size: [[13, 10px], [20, 24px]]
                      weight: bold
Ok, that’s better. Let’s do one more thing to make these labels pop a little more. Let’s add a stroke to the font. Stroke might be better described as an outline or halo around the text and takes only two properties:
                      weight: bold
                      stroke:
                          color: rgba(242, 218, 193, 0.25)
                          width: 3
I’m using a low opacity value in my rgba, so as to not make the labels too distracting. What do you think?
Ok, I’ll be honest. There is one thing that’s still bothering me.
There are just so many labels. We don’t need so many duplicate labels. Who does that help?
On first look, it seems like repeat_distance might be our answer. The repeat_distance parameter specifies the minimum distance between labels. That’s great! We can just bump up that number and away we go!
Well… not so fast.
There’s one thing we’re forgetting.
Tangram displays data in tiles. And each tile interprets repeat_distance separately. So, while a label may not repeat within a tile, it can still repeat across tiles. This can result in multiple labels per feature, spread across different tiles.
If we zoom in on a single geologic unit, this effect becomes quite obvious:
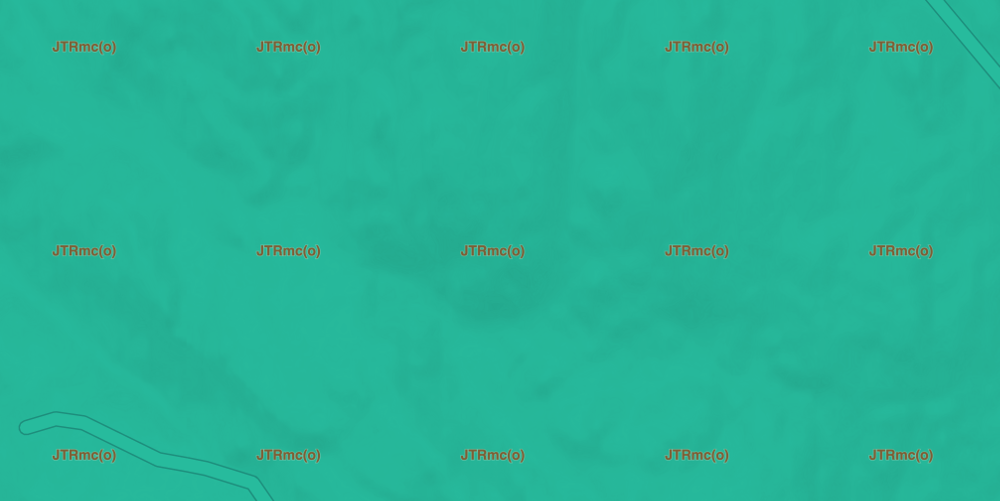
I know I’ve said this before, but… we can fix that!
Enter: the generate_label_centroids parameter.
There is an optional parameter that we can pass to our data source, called generate_label_centroids. This will create a label point at the centroid of each of our polygon features. It will also assign a {label_placement: true} property to each of the centroid labels, which will allow us to filter the labels to show only those at the polygon centroid.
Did that make sense? Let’s take a look at it in action.
In our sources block, we’ll update our _nps_geology layer to include this new parameter:
    _nps_geology:
        type: GeoJSON
        url: https://gist.githubusercontent.com/rfriberg/3c09fe3afd642224da7cd70aff1c1e70/raw/1f1df59f4cb4e82d7ea23452c789bc99c299a5cb/san_juan_nhp_geology.geojson
        generate_label_centroids: true
Then we’ll add a filter to _geology_labels to ensure we’re only displaying the centroid labels:
        # Labels sublayer
        _geology_labels:
            filter: { label_placement: true }
            draw:...
At this point, your geology_labels sublayer should look something like this:
        # Labels sublayer
        _geology_labels:
            filter: { label_placement: true }
            draw:
                text:
                    text_source: GLG_SYM
                    font:
                        fill: rgba(130, 84, 41, 0.9)
                        size: [[13, 10px], [20, 24px]]
                        weight: bold
                        stroke:
                            color: rgba(242, 218, 193, 0.3)
                            width: 3
We should note that _geology_labels is still following the rules of its parent layer’s filter; it has simply added a second set of filtering rules. We can further refine this filter, by displaying our labels at zoom level 13 and above:
        # Labels sublayer
        _geology_labels:
            filter: { label_placement: true,  $zoom: { min: 13 } }
By the way, the format I used above ({ label_placement: true, $zoom: { min: 13 } }) is a shortcut for mapping multiple filters using the all filter. This is equivalent to:
        # Labels sublayer
        _geology_labels:
            filter:
                all:
                    - label_placement: true
                    - $zoom: { min: 13 }
Phew! Labels. Amiright?
This is usually the point where I am extremely grateful that I can build off of gorgeous, existing cartography (like the Mapzen basemaps *cough* *cough*), and don’t have to worry about things like highway shields or water transformations at different zoom levels.
I sense a segue coming…
Though there are times when that gorgeous cartography might get in the way of our map’s primary focus.
Ah, there it is.
Overriding basemap features
Perhaps it’s better if I show you what I mean. Let’s take a closer look at English Camp on our map:
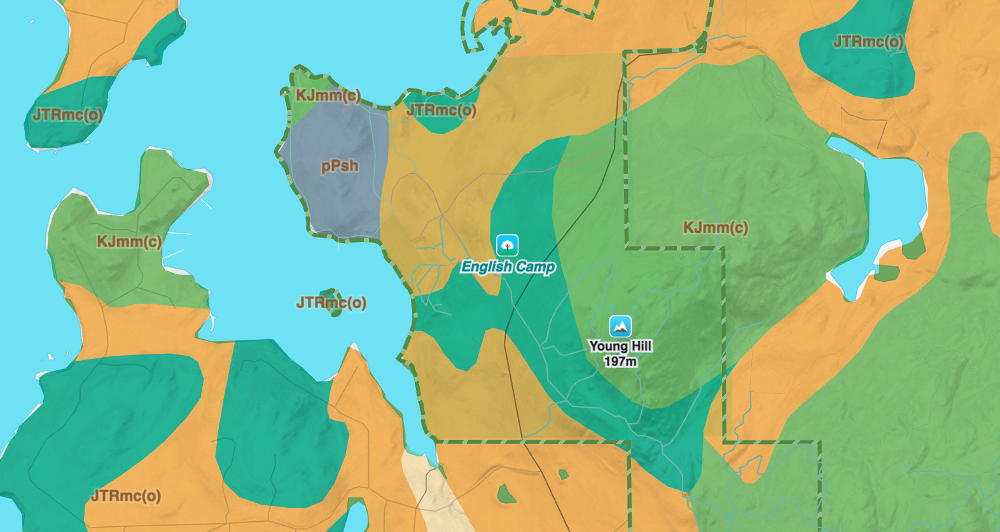
Have you noticed something a little off with that orange color within our national park boundary? What’s happening is that orange (as well as the surrounding colors, though less noticeably so) is blending with Walkabout’s landuse layer, which is typically a nice, soothing green. In our case, however, the colors blend to create a somewhat distracting region of muted colors.
Maybe it’s not a big deal. Maybe I’m being picky. Let’s fix it just the same.
The easiest way to fix this is to override Walkabout’s landuse layer and simply set its visibility to false. At the bottom of your scene file, add the following layer:
    landuse:
        visible: false
Because this layer has already been defined in an imported scene file, we don’t need to set any other parameters. We simply pass in the parameter we want to override.
Easy!

Well, easy if you happen to share an office with the architects of Walkabout. Admittedly, it’s much less easy if you need to sift through the Walkabout yaml file to figure out layer names and settings.
To make this is a little less painful, we’ll use Tangram Play, Mapzen’s live Tangram style editor.
In your browser, go to https://mapzen.com/tangram/play/#13.4608/48.5872/-123.1450 (this link will position you right over English Camp on San Juan Island).
In the default.yaml file on the right, delete everything and replace with a single line:
import: https://mapzen.com/carto/walkabout-style/3/walkabout-style.zip
Then click the Inspect button in the top right corner.
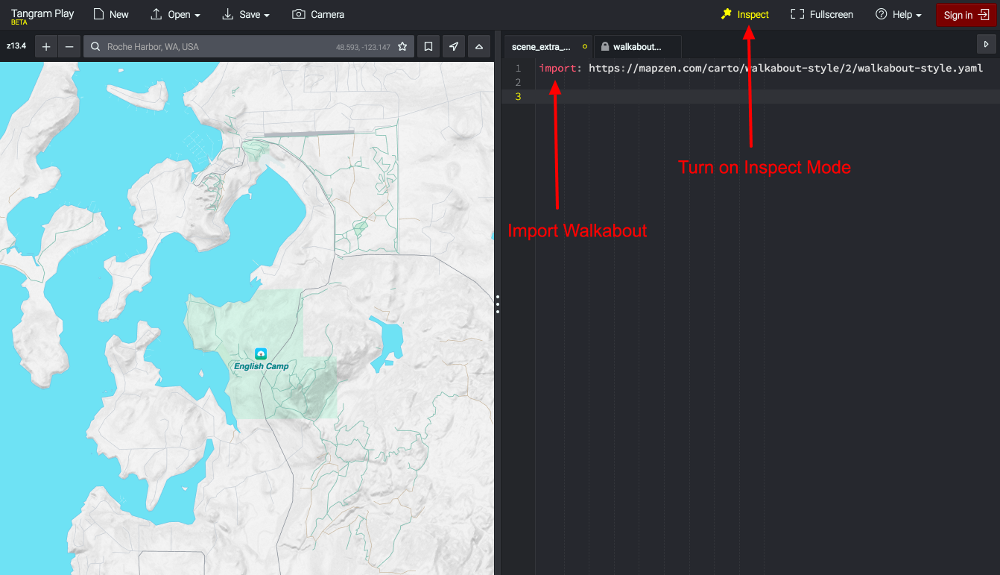
Inspect mode will allow you to move your cursor across the map and get information about each layer, including the layer name(s) that Walkabout uses for styling.
Go ahead and click on the green national park polygon:
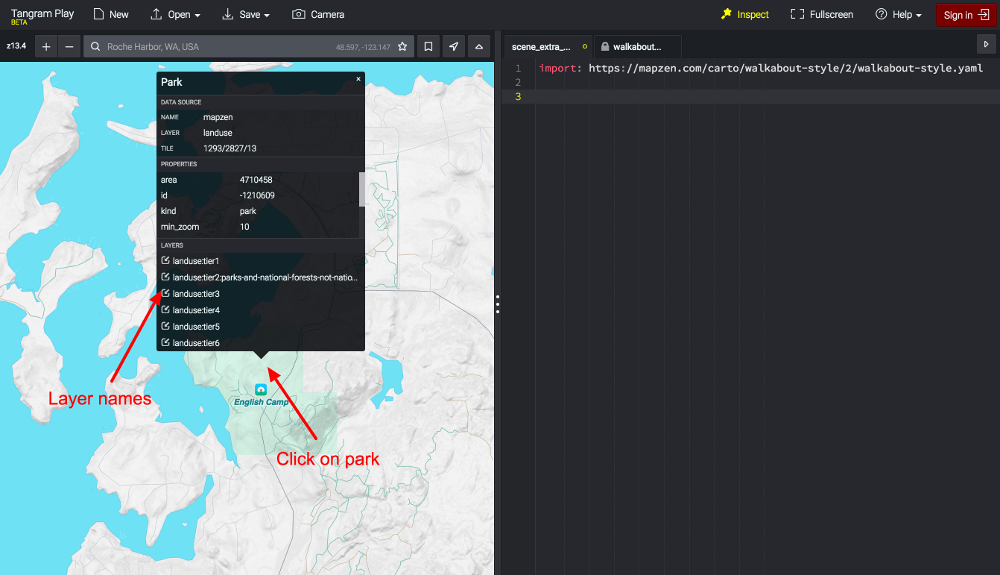
As you’ll see, it’s part of a layer named “landuse”. In the default.yaml file, add the following just beneath the import line:
layers:
    landuse:
        visible: false
You should no longer see the green of the national park. We have effectively turned off the entire landuse layer.
We can do the same with sublayers. Just south of the park are several small roads, which I’d like to hide on our map. If you click on one of the minor roads, you’ll see the layer information:
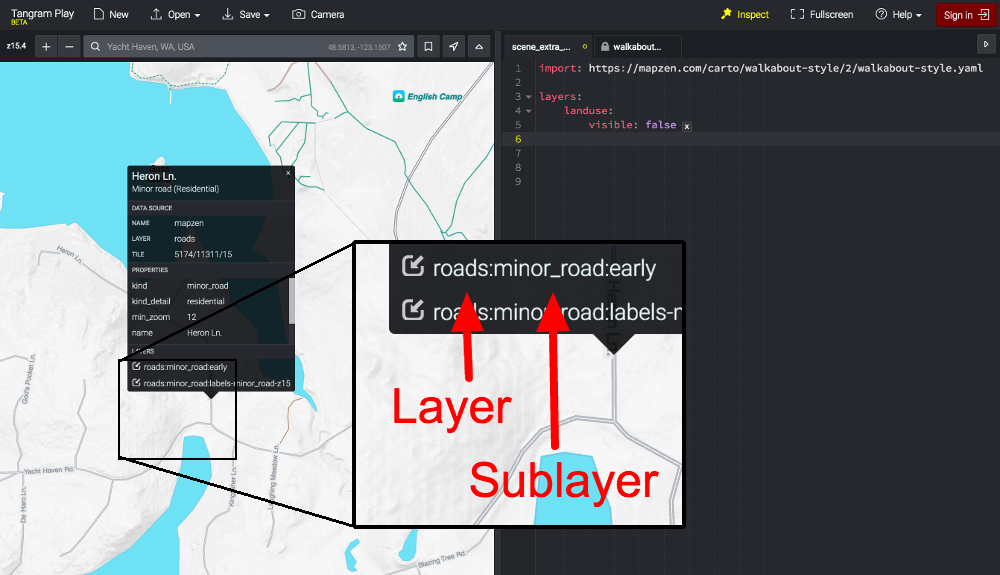
At the bottom, you’ll see that minor_road is a sublayer of roads. We don’t want to turn off all roads, just the minor roads, so we’ll want to target just this sublayer.
In the default.yaml file, add another layer reference:
    roads:
        minor_road:
            visible: false
As expected, this turns off only the minor_road sublayer. This method doesn’t just work for the visibility parameter. If we wanted, we could make other changes to the existing layer, including changing the road color, width, and outline:
    roads:
        minor_road:
            draw:
                lines:
                    color: red
                    width: 8px
                    outline:
                        color: darkred
                        width: 1px
It’s not quite the cartographic marvel I was going for, but you get the idea.
Once we’ve figured out which layers we want to turn off (or modify) using Tangram Play, we can then copy and paste those layers back into our local scene.yaml file:
    landuse:
        visible: false
    roads:
        minor_road:
            visible: false
And we’re done!
The full code for this exercise can be seen on bl.ocks.org. You can also view and modify the final scene file using Tangram Play.
Thanks for coming along on another whirlwind tour of mapzen.js and the Tangram scene file. Stay tuned for the next Make Your Own [ ] post when we’ll talk about ways we can add interactivity to our map. It’s gonna be a good one!
If you have questions or want to show off something you’ve made with Mapzen, drop us a line. We love to hear from you!
Check out additional tutorials from the Make Your Own series:
