Back in July, we mentioned that we were testing a new library to simplify the process of displaying Mapzen’s signature maps (like Bubble Wrap, Walkabout, and Tron 2.0) on the web. Today we are starting a new series looking at how you can use mapzen.js to create and embed beautiful maps on your website.
As an introduction to mapzen.js, I want to walk you through how to create a map on the web in under one minute. Just a simple map, but a map with a link that you can send to anyone with an internet connection. In. Just. One. Minute.
After that, we’ll take a look at some of the bells and whistles that mapzen.js provides, to help give your map that little something extra.
The One Minute Map
Let’s start by setting up a simple map. We could do this by creating an HTML file right on your local computer, and we will do that later in the series. But for this exercise, I’m going to show you how to use GitHub gists to create a map in no time at all (and no GitHub account required).
Set your timer and let’s begin…
Go to https://gist.github.com. If you have a GitHub account, go ahead and log in, but you don’t need one for this exercise.
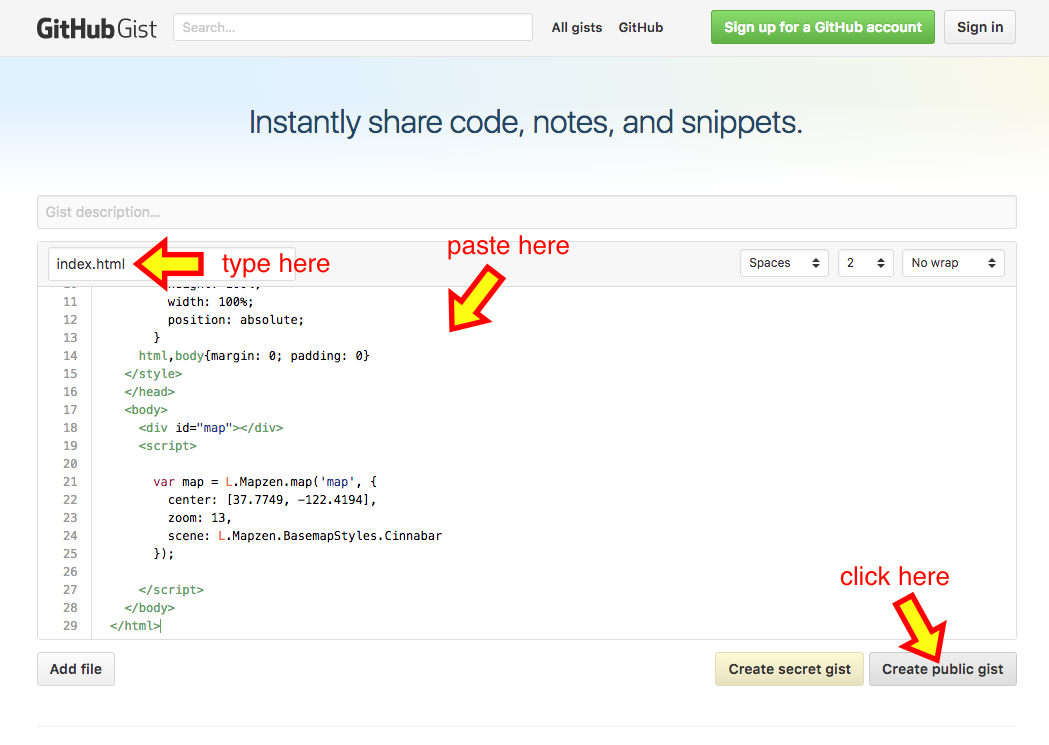
For “Filename including extension” type in
index.html. (Gist description is optional.)In the large white box, copy and paste in the following html code:
  <!DOCTYPE html>
  <html lang="en">
    <head>
      <title>One Minute Map</title>
      <meta charset="utf-8">
      <link rel="stylesheet" href="https://www.nextzen.org/js/nextzen.css">
      <script src="https://www.nextzen.org/js/nextzen.min.js"></script>
      <style>
        #map {
          height: 100%;
          width: 100%;
          position: absolute;
        }
      html,body{margin: 0; padding: 0}
    </style>
    </head>
    <body>
      <div id="map"></div>
      <script>
        // Mapzen API key (replace key with your own)
        // To generate your own key, go to https://mapzen.com/developers/
        L.Mapzen.apiKey = 'mapzen-JA21Wes';

        var map = L.Mapzen.map('map', {
          center: [37.7749, -122.4194],
          zoom: 13,
          scene: L.Mapzen.BasemapStyles.Cinnabar
        });

      </script>
    </body>
  </html>
Click Create public gist. The page will reload with your saved file (i.e., your gist).
Next, click into the URL at the top of your browser and replace “gist.github.com” with “bl.ocks.org”
so that:
https://gist.github.com/<username>/<id>becomes:
https://bl.ocks.org/<username>/<id>Hit enter to view your map at
https://bl.ocks.org/<username>/<id>
Stop that timer because you just made a map! In under a minute!
w00t! Go ahead and take a look around. Click “Open” to view the map full screen. Click and drag to move around. Click the plus and minus buttons to zoom in and out.
I’ll wait here while you explore. Here’s a handy countdown GIF (no pressure!) and a screenshot of what you should see in the gist:
Under The Hood
Pretty cool, right? Now let’s take a closer look at this file and some of the options we have available.
Note: If you’ve signed into GitHub, you’ll be able to edit your existing gist. If you are working with an “anonymous” gist, you’ll need to create a new one at https://gist.github.com.
To create this map, we needed three essential pieces:
The reference to our mapzen.js library, which includes a JavaScript file and a CSS file:
  <link rel="stylesheet" href="https://www.nextzen.org/js/nextzen.css">
  <script src="https://www.nextzen.org/js/nextzen.min.js"></script>
An html div container for our map:
<div id="map"></div>Some simple JavaScript to define our map and attach it to the
mapdiv:// Mapzen API key (replace key with your own) // To generate your own key, go to https://mapzen.com/developers/ L.Mapzen.apiKey = 'mapzen-JA21Wes'; var map = L.Mapzen.map('map', { center: [37.7749, -122.4194], zoom: 13, scene: L.Mapzen.BasemapStyles.Cinnabar });
UPDATE March 1, 2017: A Mapzen developer API key is now required for mapzen.js. We’ve updated the Make Your Own series to include a demo key. Generate your own free API key at https://mapzen.com/developers/.
In this snippet (above), we set the starting point of the map at San Francisco ([37.7749, -122.4194]), with a zoom level of 13. The scene is one of Mapzen’s house styles, Cinnabar.
Try swapping out L.Mapzen.BasemapStyles.Cinnabar with one of our other house styles: https://mapzen.com/documentation/mapzen-js/api-reference/#basemap-styles
For example:
  var map = L.Mapzen.map('map', {
      center: [37.7749, -122.4194],
      zoom: 13,
      scene: L.Mapzen.BasemapStyles.Refill
  });
You may have noticed from the API documentation that each of these constants is simply a reference to a specific .yaml file. In this case, L.Mapzen.BasemapStyles.Refill points to https://mapzen.com/carto/refill-style/refill-style.yaml.
YAML (a delightfully recursive acronym that stands for YAML Ain’t Markup Language) is the format expected by Tangram, the map rendering engine used by mapzen.js to render Mapzen’s house basemap styles.
Next week, I’ll show you how we can create a scene file to style our own data.
Bells and Whistles
Up to this point, we could have used Leaflet + Tangram’s own javascript API to create the map above. Why use mapzen.js at all?
We’ve built mapzen.js to be an easy entry point into Mapzen maps and services. In addition to quickly adding Mapzen map styles to a Leaflet map, we’ve added a few “bells and whistles” to help you test out some of our other services.
Let’s dive back into our index.html file and check out a few of these services.
Again, edit your gist or create a new one to follow along.
Search
How about a search box so you can jump to your favorite locations? At the bottom of your script block, add the following:
  var geocoder = L.Mapzen.geocoder();
  geocoder.setPosition('topright');
  geocoder.addTo(map);
The topright position refers to the map corner we wish to display this control. These options are part of Leaflet’s Control Positions.
See the geocoder API reference for more information on customizing the interaction and search query behavior.
Locator
Let’s also add a locator button so you can quickly zoom to your own location:
  var locator = L.Mapzen.locator();
  locator.addTo(map);
(Note: you’ll need allow your browser to share your location for this to work.)
URL Hash
And finally, we’ll add a URL hash to the map, to allow for deep linking to the map location and zoom level.
  L.Mapzen.hash({
    map: map,
    geocoder: geocoder
  });
As you zoom and pan around the map, the position will be saved as a URL hash, which allows you to send a link to specific place on your map.
Your index.html file should now look something like this:
<!DOCTYPE html>
<html lang="en">
  <head>
    <title>Bells and Whistles</title>
    <meta charset="utf-8">
    <link rel="stylesheet" href="https://www.nextzen.org/js/nextzen.css">
    <script src="https://www.nextzen.org/js/nextzen.min.js"></script>
    <style>
      #map {
        height: 100%;
        width: 100%;
        position: absolute;
      }
    html,body{margin: 0; padding: 0}
  </style>
  </head>
  <body>
    <div id="map"></div>
    <script>
      // Mapzen API key (replace key with your own)
      // To generate your own key, go to https://mapzen.com/developers/
      L.Mapzen.apiKey = 'mapzen-JA21Wes';

      var map = L.Mapzen.map('map', {
        center: [37.7749, -122.4194],
        zoom: 13,
        scene: L.Mapzen.BasemapStyles.Refill
      });

      // Mapzen search box
      var geocoder = L.Mapzen.geocoder();
      geocoder.setPosition('topright');
      geocoder.addTo(map);

      // Mapzen locator (i.e., Find my location)
      var locator = L.Mapzen.locator();
      locator.addTo(map);

      // Mapzen hash (for deep linking to map location and state)
      L.Mapzen.hash({
        map: map,
        geocoder: geocoder
      });

    </script>
  </body>
</html>
Full demo can be seen at https://bl.ocks.org/rfriberg/3c1e2447a77958e893a74a279014499b
Thanks for coming along on this introductory tour of mapzen.js. Today was just a small taste of all the great things going into mapzen.js and the power behind the Tangram rendering engine. Next week, we’ll dive into how we can set up a scene file to display our own data over one of Mapzen’s signature basemaps.
In the meantime, if you have any questions or want to show us how you’re using mapzen.js, just drop us a line!
Check out additional tutorials from the Make Your Own series:
